Logs

Your Magnolia PaaS Logs section in the Cockpit displays logs for pods, domains, ingresses, and more. Each section has dedicated filtering by their relevant components as well as by a date range.

There are several different types of logs which are covered on this page. See the subsections below more for more details.

Magnolia Backend

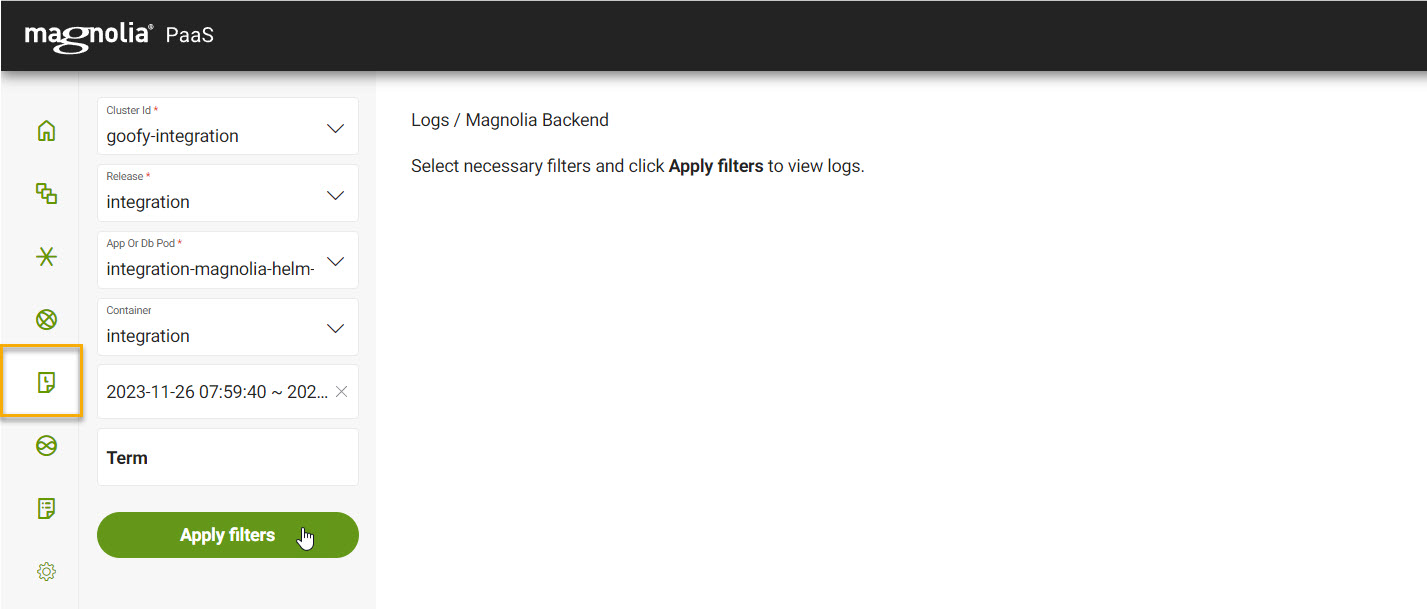
Magnolia Backend displays log information from Kubernetes Pods associated with the Magnolia backend. You can access the pods logs by going to your Cockpit and navigating to the Logs section.

How long do you keep the logs?

Generally, we keep logs for 30 days. However, for your deployment, you may configure a different duration.

From Logs > Magnolia Backend:

View from the Cockpit
pod logs backend

  1. Select your desired Cluster ID from the dropdown list.

  2. Select your desired Release from the dropdown list.

  3. Select your desired App or Database pod from the dropdown list.

  4. Select your desired Container from the dropdown list.

  5. Select your desired Date Range.

  6. Input any filter terms under Term. This filters the results by the term you’ve entered.

  7. Click Apply filters.

Log format

Log fields

Field Description Example

date

string

The log date.

"[14/Mar/2022:16:01:50 +0000]"

log level

string

The severity of the log such as INFO or WARN.

INFO

log message

string

The log message.

info.magnolia.module.scheduler.SchedulerModule : Job configScan added [0 0 0 * * ?]. Will fire for the first time on Thu Mar 31 at 00:00:00 CEST 2024

Example

See sample file

2022-03-31 07:02:00,1982022-03-31 09:01:59,968 INFO info.magnolia.multisite.registry.MultiSiteRegistry: Following sites are registered: [sportstation, travel].
2022-03-31 10:00:00,0852022-03-31 12:00:00,002 INFO info.magnolia.module.scheduler.CommandJob : Starting job [cleanTempFiles]...
2022-03-31 10:00:00,0852022-03-31 12:00:00,003 INFO info.magnolia.module.scheduler.CommandJob : Job executed successfully [cleanTempFiles]

Magnolia Frontend

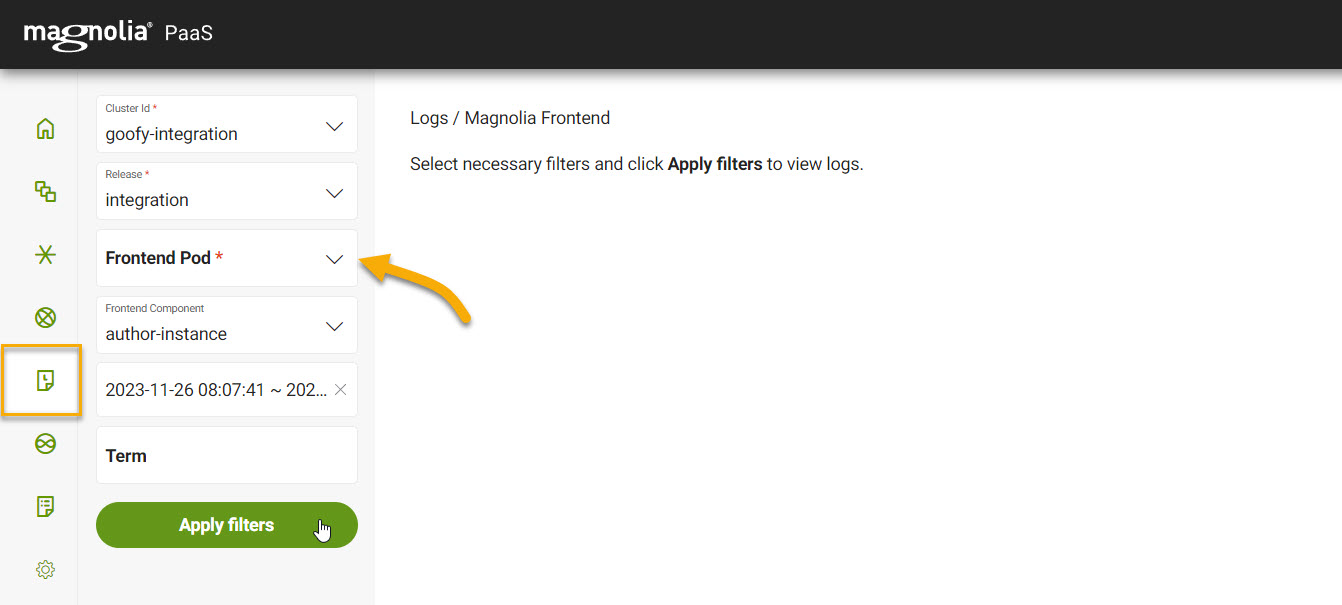
Magnolia Frontend displays log information from Kubernetes Pods associated with the Magnolia frontend. You can access the pods logs by going to your Cockpit and navigating to the Logs section.

How long do you keep the logs?

Generally, we keep logs for 30 days. However, for your deployment, you may configure a different duration.

From Logs > Magnolia Frontend:

View from the Cockpit
pod logs frontend

  1. Select your desired Cluster ID from the dropdown list.

  2. Select your desired Release from the dropdown list.

  3. Select your desired Frontend pod from the dropdown list.

  4. Select your desired Frontend component from the dropdown list.

    This is typically the public or author instance.

  5. Select your desired Date Range.

  6. Input any filter terms under Term. This filters the results by the term you’ve entered.

  7. Click Apply filters.

Log format

Log fields

Field Description Example

date

string

The log date.

"[14/Mar/2022:16:01:50 +0000]"

log level

string

The severity of the log such as INFO or WARN.

INFO

log message

string

The log message.

info.magnolia.module.scheduler.SchedulerModule : Job configScan added [0 0 0 * * ?]. Will fire for the first time on Thu Mar 31 at 00:00:00 CEST 2024

Example

See sample file

2022-03-31 07:02:00,1982022-03-31 09:01:59,968 INFO info.magnolia.multisite.registry.MultiSiteRegistry: Following sites are registered: [sportstation, travel].
2022-03-31 10:00:00,0852022-03-31 12:00:00,002 INFO info.magnolia.module.scheduler.CommandJob : Starting job [cleanTempFiles]...
2022-03-31 10:00:00,0852022-03-31 12:00:00,003 INFO info.magnolia.module.scheduler.CommandJob : Job executed successfully [cleanTempFiles]

Fastly domain logs

Magnolia PaaS stores Fastly cache logs. The default setup and deployment stores customer IPs for a configurable amount of time. However, if you do not want customer IPs included in the logs at all, this is also something that can be configured.

How long do you keep the logs?

Generally, we keep logs for 30 days. However, for your deployment, you may configure a different duration.

From Logs > Domains:

View from the Cockpit

domain logs

  1. Select your desired Cluster Id.

  2. Select your desired Domain Name.

  3. Select your desired Range.

  4. If desired, enter a term to filter on.

  5. Click Apply filters.

Log format

Each cache log is broken down by host and tenant. Hosts are the host website and tenants are the individual tenant within the Magnolia PaaS deployment.

Example

host = www.magnolia-cms.com and tenant = magnolia

Log fields

Field Description Example

response length

integer

The size of response in bytes, excluding HTTP headers.

86601

cache_status

string

The cache status.

possible values
  • PASS

  • MISS

  • HIT

  • UNKNOWN

"PASS"

cluster_name

string

The name of the Kubernetes cluster.

"magnolia-production"

date

string

The log date.

"[14/Mar/2022:16:01:50 +0000]"

host

string

The host URL.

"www.magnolia-cms.com"

ip

string

The IP of the tenant.

"217.243.XXX.XX"

method

string

The method used.

"GET"

path

string

The URL path.

"/path/ch"

protocol

string

The HTTP protocol used.

"HTTP/1.1"

request_time

integer

The request time in milliseconds.

22

round_trip

integer

The total round trip time in milliseconds.

5574

wr_decision

The waiting room decision.

possible values
  • anon: The initial state. This is an anonymous user who needs a cookie set to enter the waiting room.

  • wait: The user must wait. This is a user that already has a cookie with an expiry time set.

  • re-wait: The user has already waited for the initial expiry duration. However, the system decided to force the user to wait again with a new cookie expiry time.

  • allow: This is the final state. The user has waited the full duration of the cookie expiry time. The system has now allowed the user to enter the waiting room.

  • deny: The system has denied access to the user or an error has occurred with the system.

anon

wr_expires

The time left until the next waiting room decision (in milliseconds).

1706345190

status

integer

The HTTP status code.

200

ts

date:time

The timestamp in ISO 8601 format.

2022-03-14T16:01:51.596Z

tsNs

integer

The timestamp in nanoseconds.

1647273711596698629

zone

string

Which CDN data center this request hit.

"HHN"

WAF logs

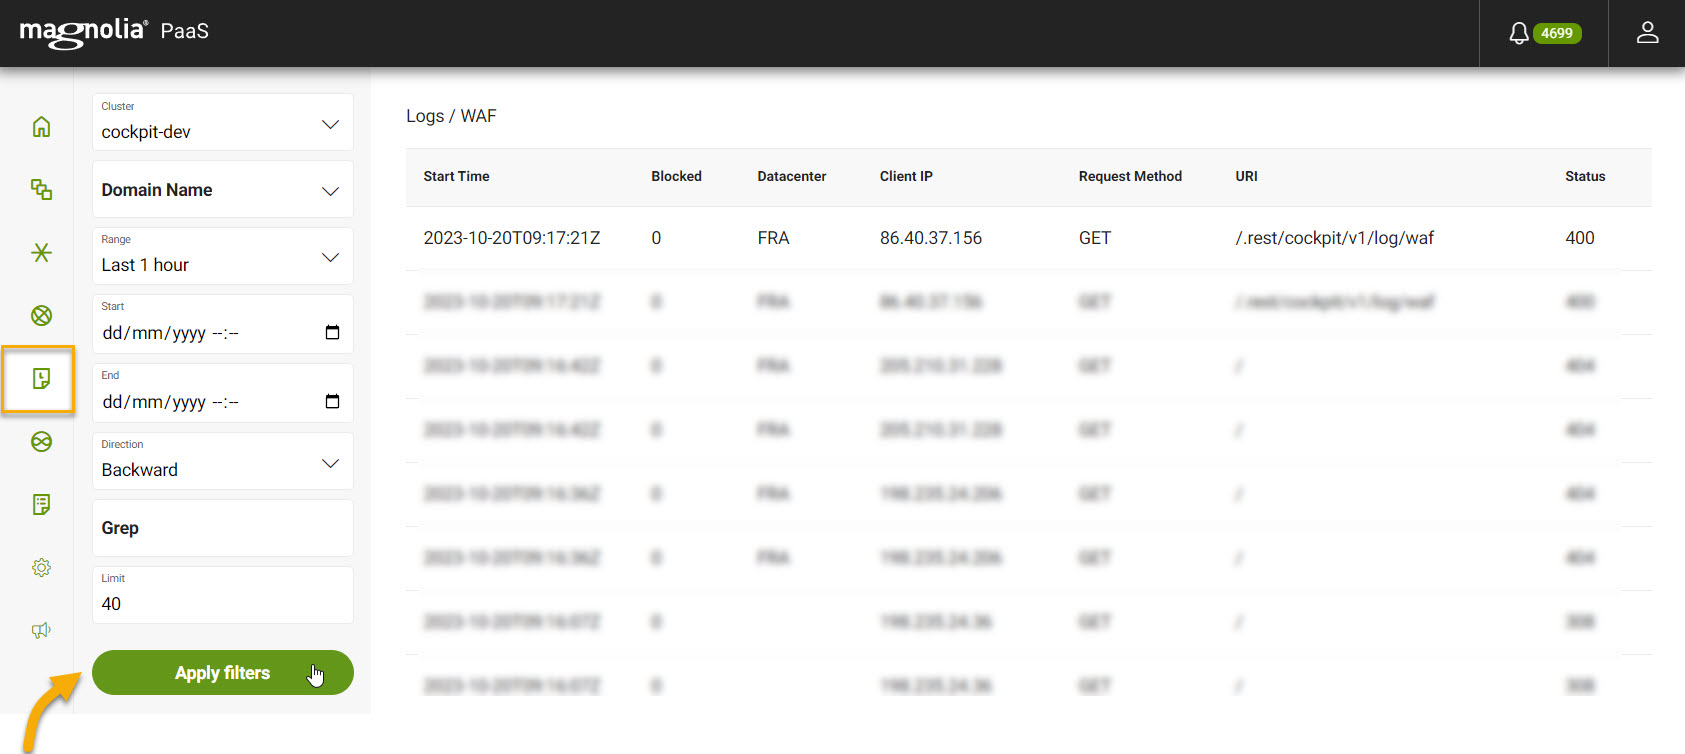
WAF logs displays log information from your Web Application Firewall rules. You can access the WAF logs by going to your Cockpit and navigating to the Logs section.

How long do you keep the logs?

Generally, we keep logs for 30 days. However, for your deployment, you may configure a different duration.

From Logs > WAF:

View from the Cockpit
waf logs

  1. Select your desired Cluster from the dropdown list.

  2. Select your desired Domain from the dropdown list.

  3. Select your desired Range.

  4. Select the direction.

    Forward means chronological ordering. Backward means reverse chronological ordering.

  5. If desired, use Grep.

  6. Set the Limit for the number of logs you want to see.

  7. Click Apply filters.

Log format

Log fields

Field Description Example

Start Time

string

The start time for the request.

"2022-06-14 12:59:42,971"

Blocked

boolean

Boolean stating if the request was blocked.

  • 0 - not blocked

  • 1 - blocked

See waf.blocked for more details.

1

Datacenter

string

The Datacenter through which the request passed.

LGB

Client IP

string

The client IP address.

205.XXX.31.23

Request Method

string

The request method.

GET

URI

string

The relative path of your site the request was attempting to access.

/

Status

integer

The HTTP status code of the request.

308

Kubernetes ingress logs

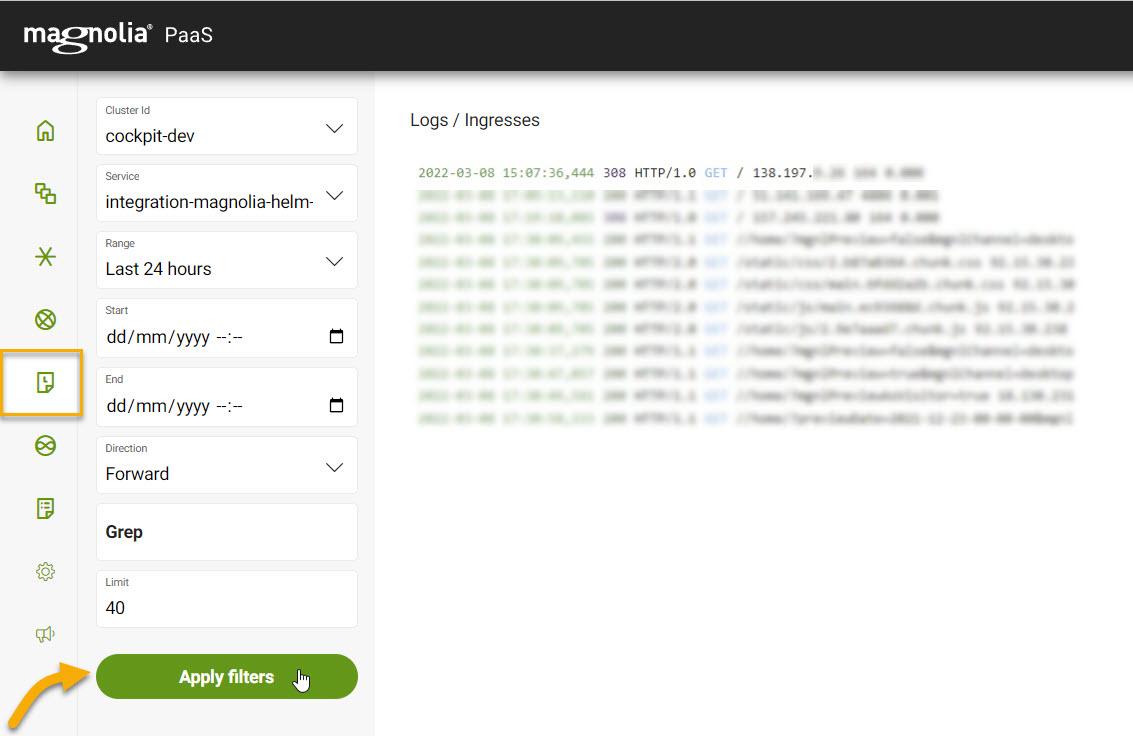
Kubernetes ingress logs displays log information from Kubernetes ingresses. You can access the Ingress logs by going to your Cockpit and navigating to the Logs section.

How long do you keep the logs?

Generally, we keep logs for 30 days. However, for your deployment, you may configure a different duration.

From Logs > Ingresses:

View from the Cockpit
ingress logs

  1. Select your desired Cluster Id.

  2. Select your desired Service from the dropdown list.

  3. Select your desired Range.

  4. Select the direction.

    Forward means chronological ordering. Backward means reverse chronological ordering.

  5. If desired, use Grep.

  6. Set the Limit for the number of logs you want to see.

  7. Click Apply filters.

Log format

Log fields

Field Description Example

date

string

The log date.

[14/Mar/2022:16:01:50 +0000]

Status Code

integer

The HTTP status code.

200

http protocol

string

The HTTP protocol used.

"HTTP/1.1"

method

string

The method used.

"GET"

url

string

The URL path.

"/path/ch"

ip

string

The IP of the tenant.

"217.243.XXX.XX"

response length

integer

The size of response in bytes, excluding HTTP headers.

86601

response time

integer

The response time in milliseconds.

22

Example

See sample file

2022-03-15 15:06:42,537200HTTP/2.0GET/.magnolia/admincentral/PUSH?v-uiId=0&v-pushId=84943f81-6f6d-450c-9807-d9e79d1a8ceb&X-Atmosphere-tracking-id=8cf8846e-6493-40f4-962f-c52813ebc029&X-Atmosphere-Framework=2.3.2.vaadin2-javascript&X-Atmosphere-Transport=long-polling&X-Atmosphere-TrackMessageSize=true&Content-Type=application%2Fjson%3B%20charset%3DUTF-8&X-atmo-protocol=true&_=164735674225851.154.180.41204960.005
2022-03-15 15:07:35,429200HTTP/2.0POST/.magnolia/admincentral/HEARTBEAT/?v-uiId=051.154.180.41200.006
2022-03-15 15:07:47,473200HTTP/2.0GET/.magnolia/admincentral/PUSH?v-uiId=0&v-pushId=84943f81-6f6d-450c-9807-d9e79d1a8ceb&X-Atmosphere-tracking-id=8cf8846e-6493-40f4-962f-c52813ebc029&X-Atmosphere-Framework=2.3.2.vaadin2-javascript&X-Atmosphere-Transport=long-polling&X-Atmosphere-TrackMessageSize=true&Content-Type=application%2Fjson%3B%20charset%3DUTF-8&X-atmo-protocol=true&_=164735680732551.154.180.41204959.999
2022-03-15 15:07:47,974200HTTP/2.0POST/.magnolia/admincentral/UIDL/?v-uiId=051.154.180.411220.005
2022-03-15 15:08:52,648200HTTP/2.0GET/.magnolia/admincentral/PUSH?v-uiId=0&v-pushId=84943f81-6f6d-450c-9807-d9e79d1a8ceb&X-Atmosphere-tracking-id=8cf8846e-6493-40f4-962f-c52813ebc029&X-Atmosphere-Framework=2.3.2.vaadin2-javascript&X-Atmosphere-Transport=long-polling&X-Atmosphere-TrackMessageSize=true&Content-Type=application%2Fjson%3B%20charset%3DUTF-8&X-atmo-protocol=true&_=164735687249751.154.180.41204960.001
2022-03-15 15:09:05,432200HTTP/2.0POST/.magnolia/admincentral/HEARTBEAT/?v-uiId=051.154.180.41200.006
2022-03-15 15:09:15,710200HTTP/2.0GET/.magnolia/admincentral51.154.180.419370.008
2022-03-15 15:09:15,710200HTTP/2.0GET/.magnolia/admincentral/PUSH?v-uiId=0&v-pushId=84943f81-6f6d-450c-9807-d9e79d1a8ceb&X-Atmosphere-tracking-id=8cf8846e-6493-40f4-962f-c52813ebc029&X-Atmosphere-Framework=2.3.2.vaadin2-javascript&X-Atmosphere-Transport=long-polling&X-Atmosphere-TrackMessageSize=true&Content-Type=application%2Fjson%3B%20charset%3DUTF-8&X-atmo-protocol=true&_=164735693826451.154.180.41204917.281
2022-03-15 15:09:15,710200HTTP/2.0GET/.magnolia/admincentral/APP/PUBLISHED/jquery-migrate-3.3.2.min.js51.154.180.4141690.004
2022-03-15 15:09:15,710200HTTP/2.0GET/VAADIN/vaadinPush.js?v=8.14.151.154.180.41133700.006
2022-03-15 15:09:15,710200HTTP/2.0GET/VAADIN/vaadinBootstrap.js?v=8.14.151.154.180.4140380.006
2022-03-15 15:09:15,710200HTTP/2.0GET/.magnolia/admincentral/APP/PUBLISHED/jquery-3.6.0.min.js51.154.180.41309470.009
2022-03-15 15:09:15,960200HTTP/2.0GET/VAADIN/widgetsets/info.magnolia.widgetset.MagnoliaProWidgetSet/info.magnolia.widgetset.MagnoliaProWidgetSet.nocache.js?164735695571051.154.180.4147460.005
2022-03-15 15:09:15,960200HTTP/2.0GET/VAADIN/themes/resurface-admincentral/styles.css?v=8.14.151.154.180.41715250.023
2022-03-15 15:09:15,960200HTTP/2.0GET/VAADIN/widgetsets/info.magnolia.widgetset.MagnoliaProWidgetSet/ckeditor/styles.css51.154.180.411910.006
2022-03-15 15:09:15,960200HTTP/2.0GET/VAADIN/widgetsets/info.magnolia.widgetset.MagnoliaProWidgetSet/GridFastNavigation/styles.css51.154.180.411030.010
2022-03-15 15:09:15,960200HTTP/2.0GET/VAADIN/widgetsets/info.magnolia.widgetset.MagnoliaProWidgetSet/vaadin-combobox-multiselect/styles.css51.154.180.411040.011
2022-03-15 15:09:15,960200HTTP/2.0GET/VAADIN/widgetsets/info.magnolia.widgetset.MagnoliaProWidgetSet/ext_token_field/exttokenfield.css51.154.180.414730.012
2022-03-15 15:09:15,960200HTTP/2.0GET/VAADIN/widgetsets/info.magnolia.widgetset.MagnoliaProWidgetSet/expandingtextarea/expandingtextarea.css51.154.180.411010.014
2022-03-15 15:09:15,960200HTTP/2.0GET/VAADIN/themes/valo/shared/img/spinner.gif51.154.180.4171940.004
2022-03-15 15:09:15,960200HTTP/2.0GET/VAADIN/widgetsets/info.magnolia.widgetset.MagnoliaProWidgetSet/jcrop/jquery.Jcrop.css51.154.180.4110420.015
2022-03-15 15:09:16,210200HTTP/2.0POST/.magnolia/admincentral?v-164735695571051.154.180.4180980.200
2022-03-15 15:09:16,210200HTTP/2.0GET/VAADIN/widgetsets/info.magnolia.widgetset.MagnoliaProWidgetSet/89EECA3564402F53349254D751338C66.cache.js51.154.180.4111709410.013
2022-03-15 15:09:16,712200HTTP/2.0GET/.magnolia/admincentral/APP/PUBLISHED/custom.css.connector.js51.154.180.412770.005
2022-03-15 15:09:16,712200HTTP/2.0GET/VAADIN/themes/resurface/fonts/roboto/light/Roboto-Light.woff251.154.180.41643200.008

Enterprise search logs

Magnolia PaaS stores Enterprise search logs. You can access the logs by going to your Cockpit and navigating to the Logs section. Enterprise search logs store a range of information from application errors to slow queries.

How long do you keep the logs?

Generally, we keep logs for 30 days. However, for your deployment, you may configure a different duration.

From Logs > Enterprise search:

View from the Cockpit
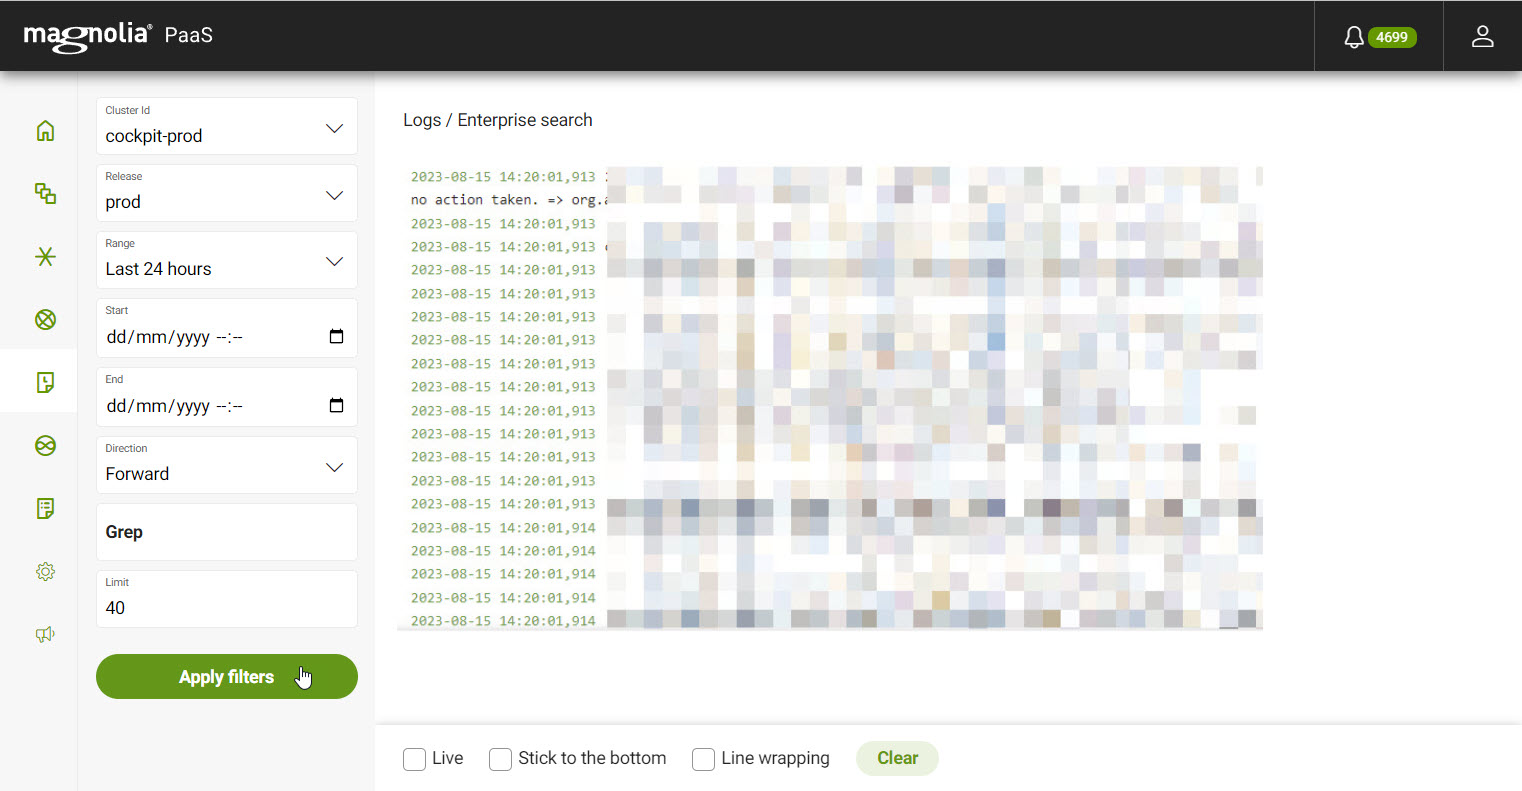
solr logs

  1. Select your desired Cluster Id from the dropdown list.

  2. Select your desired Release from the dropdown list.

  3. Select your desired Range.

  4. Select the direction.

    Forward means chronological ordering. Backward means reverse chronological ordering.

  5. If desired, use Grep.

  6. Set the Limit for the number of logs you want to see.

  7. Click Apply filters.

For more information on what you can see in these particular logs, see Solr logging.

Audit logs

Magnolia PaaS stores audit logs. Audit logs show different actions triggered by your team while they navigate and use the Cockpit. These actions range from logins to those performing backup operations.

How long do you keep the logs?

Generally, we keep logs for 30 days. However, for your deployment, you may configure a different duration.

From Logs > Audit:

View from the Cockpit
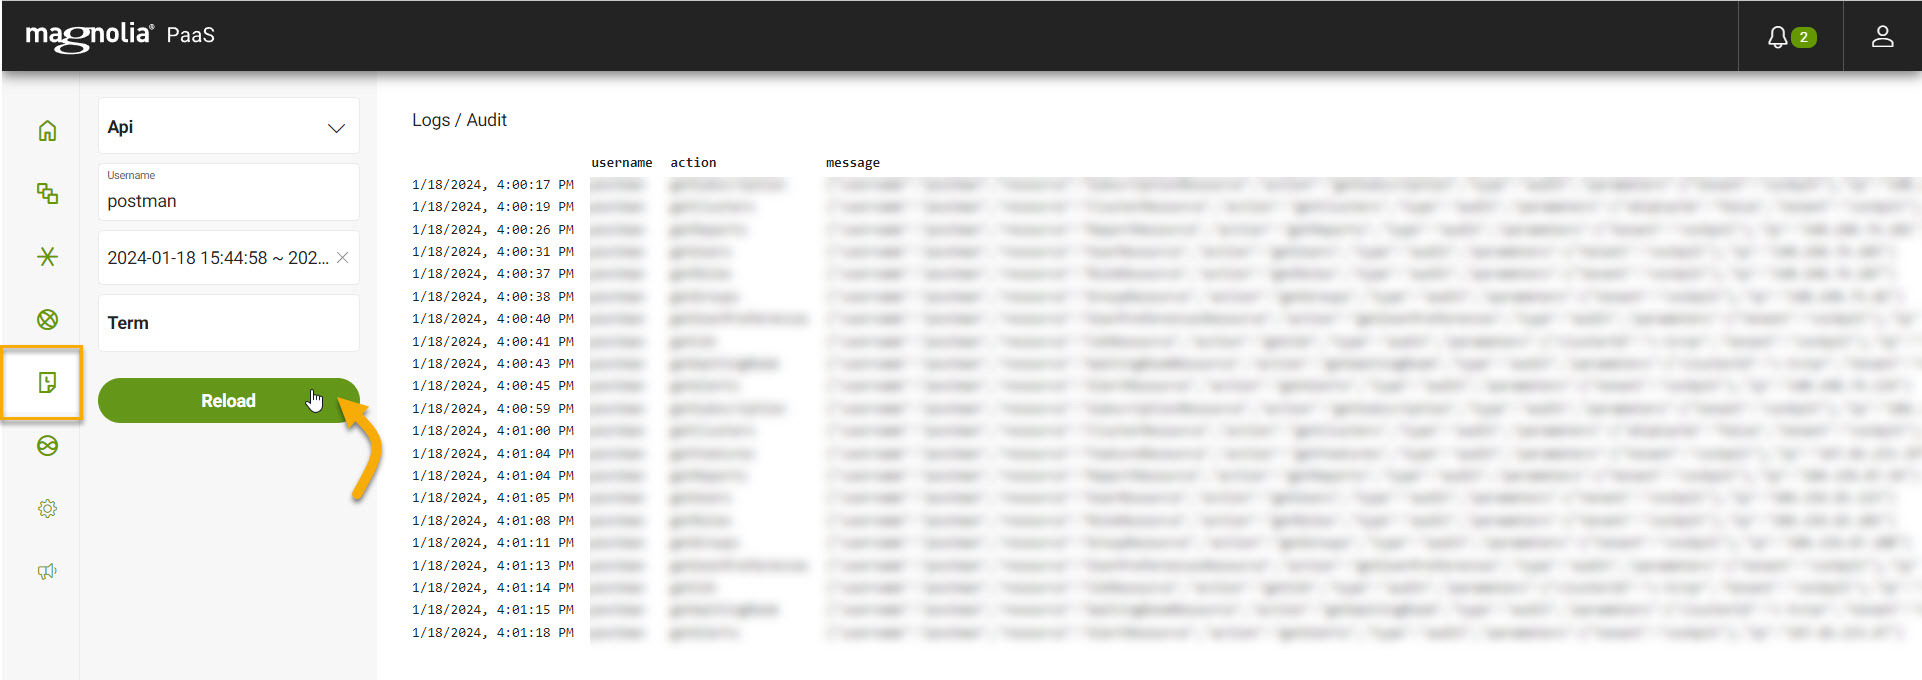
audit logs

  1. Select your desired API from the dropdown.

  2. If desired, enter a username to filter on.

  3. Select your desired Range.

  4. If desired, enter a term to filter on.

  5. Click Apply filters.

Log format

Each audit log provides a timestamp along with other pertinent information. See the Log fields below for more details.

Log fields

Field Description Example

username

string

The username of the person or entity that performed the action.

person@example.com

action

string

The action performed. This is typically an API operation.

example values
  • getUsers

  • getFeatures

  • getClusters

  • getAuditLogs

getUsers

message

object

An object containing information about the action.

{
  "username": "person@magnolia-cms.com",
  "resource": "NotificationResource",
  "action": "getNotifications",
  "type": "audit",
  "parameters": {
    "displayOnLogin": "true",
    "archived": "false",
    "read": "false",
    "size": "10",
    "countOnly": "false",
    "term": "null",
    "from": "null",
    "to": "null",
    "page": "0",
    "sort": "null",
    "tenant": "cockpit"
  },
  "ip": "142.248.74.130"
}

timestamp

date

The log timestamp. This is the date and time on which the action occurred.

"2024-01-18T04:01:32.139Z"

Feedback

PaaS

×

Location

This widget lets you know where you are on the docs site.

You are currently perusing through the Magnolia PaaS docs.

Main doc sections

DX Core Headless PaaS Legacy Cloud Incubator modules