Clusters
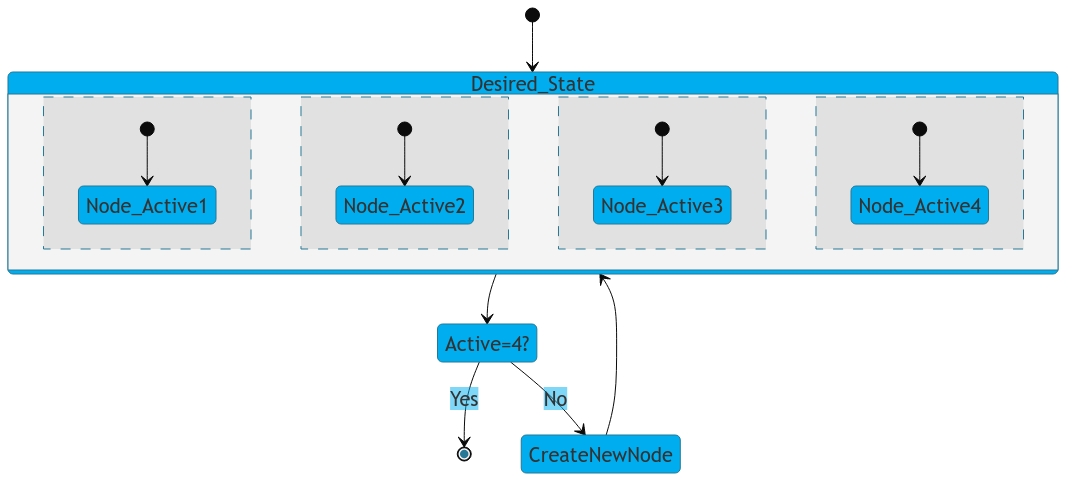
Magnolia PaaS runs on Kubernetes clusters. Kubernetes clusters are sets of node machines running containerized applications. One of the primary advantages of Kubernetes clusters is that they automatically manage your cluster to match the configured desired state.
| Check out the subsections below to get an idea of what the Cockpit displays for you regarding Clusters. |
Kubernetes flow
Let’s say you deploy your application with the desired state of having 4 nodes of your application running. If 1 of the nodes crashes, we see just 3 nodes are active, so we add 1 more to meet the desired state.
Overview
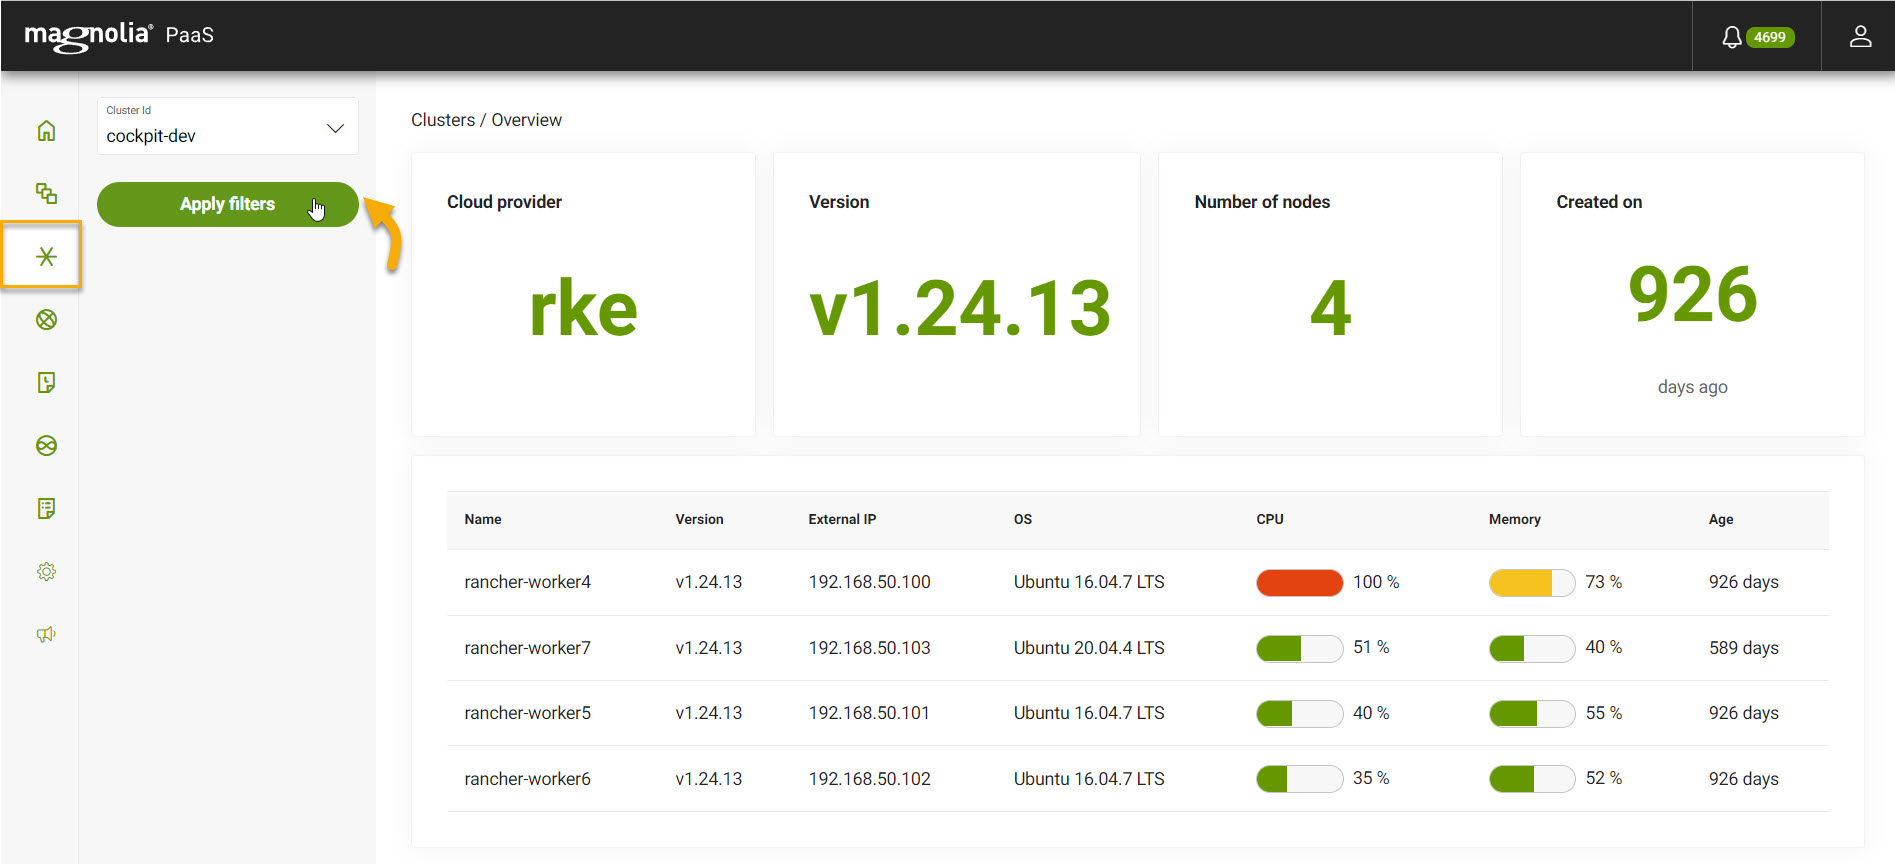
The Clusters Overview section in the Cockpit displays information about the clusters you have available in your Magnolia PaaS setup. There are typically production and integration clusters at a minimum, but each setup is different.
View cluster overview
-
Select the desired cluster from the dropdown menu entitled Cluster Id.
-
View the information.
What info is displayed?The tab display the following information:
-
Cloud provider (such as
rkestanding for Rancher Kubernetes) -
Version
-
Number of nodes
-
Created on (when the cluster was created)
There is also a table that shows more detailed cluster information such as:
-
Name (the name of the cluster)
-
Version
-
External IP
-
Operating System (OS)
-
CPU usage in percentage
-
Memory usage in percentage
-
Age of the cluster
-
Events
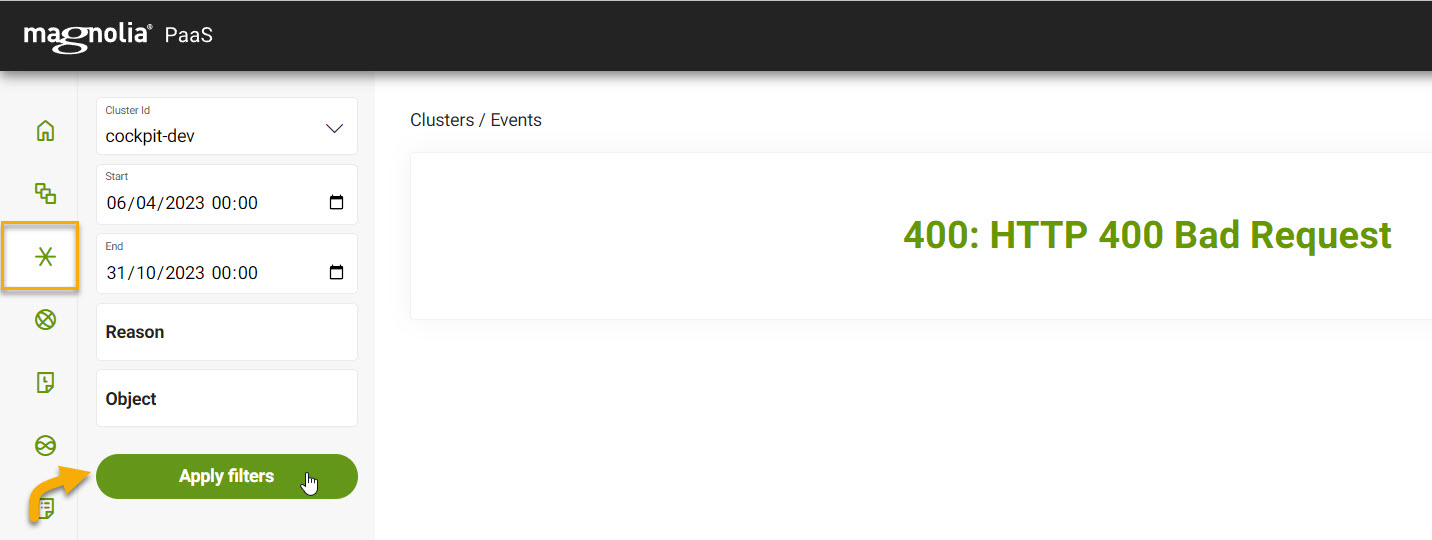
The Clusters Events section in the Cockpit displays information about the events within the cluster. These events are objects that show you exactly what is occurring inside your cluster, such scheduler decisions or why some pods are being evicted from a node.
Distribution
The Clusters Distribution section in the Cockpit displays information what pods are running on what nodes for your Magnolia PaaS project.

View distribution
-
Select the desired cluster from the dropdown menu entitled Cluster Id.
-
Optional If you want, click Hide System Resources to only display the distribution used by Magnolia only.
-
Click Apply filters.
What info is displayed?The following information is displayed:
-
The Node
-
The total available CPUs
-
The Used CPU in percentages
-
The Available memory in GB
-
The Used memory in percentages
- Additional information
-
If you want to see more details, click the plus icon to see:
-
The namespace
-
The name of the database or application
-
The number of CPU requests
-
The CPU usage against the available limit
-
The Memory requests
-
The Memory usage against the available limit
-
CPU
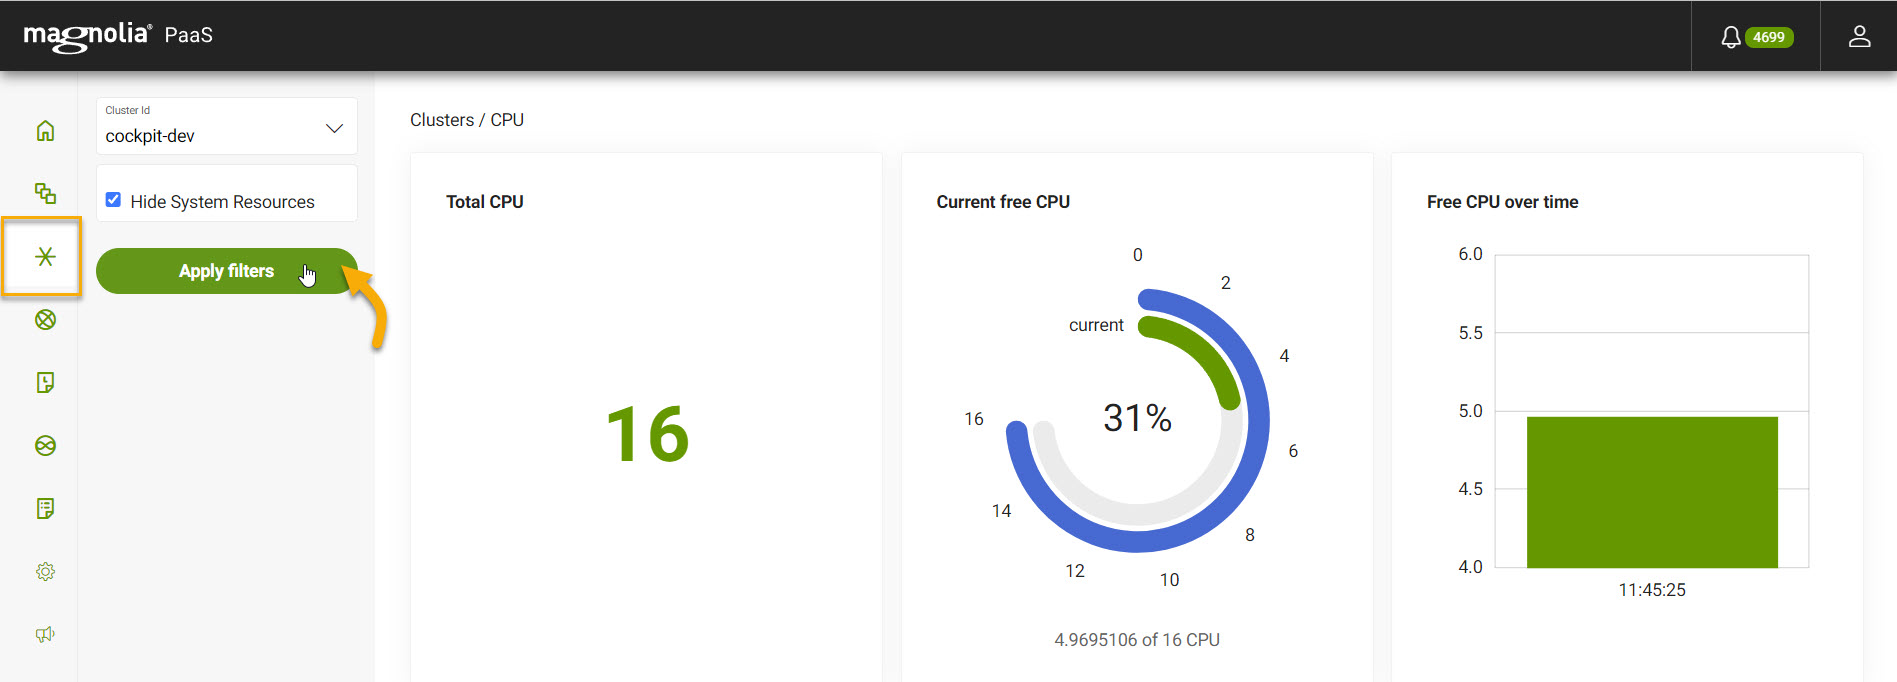
The Clusters CPU in the Cockpit displays information about CPUs for your Magnolia PaaS project.
View cluster CPU
-
Select the desired cluster from the dropdown menu entitled Cluster Id.
-
Optional If you want, click Hide System Resources to only display the distribution used by Magnolia only.
-
Click Apply filters.
What info is displayed?The following information is displayed:
-
Total available CPU
-
Current Free CPU against the maximum available CPU
-
Free CPU over time
-
Total CPU reserved
-
Total CPU limit
-
Table breaking down CPU limits by node and type (app or database)
-
Memory
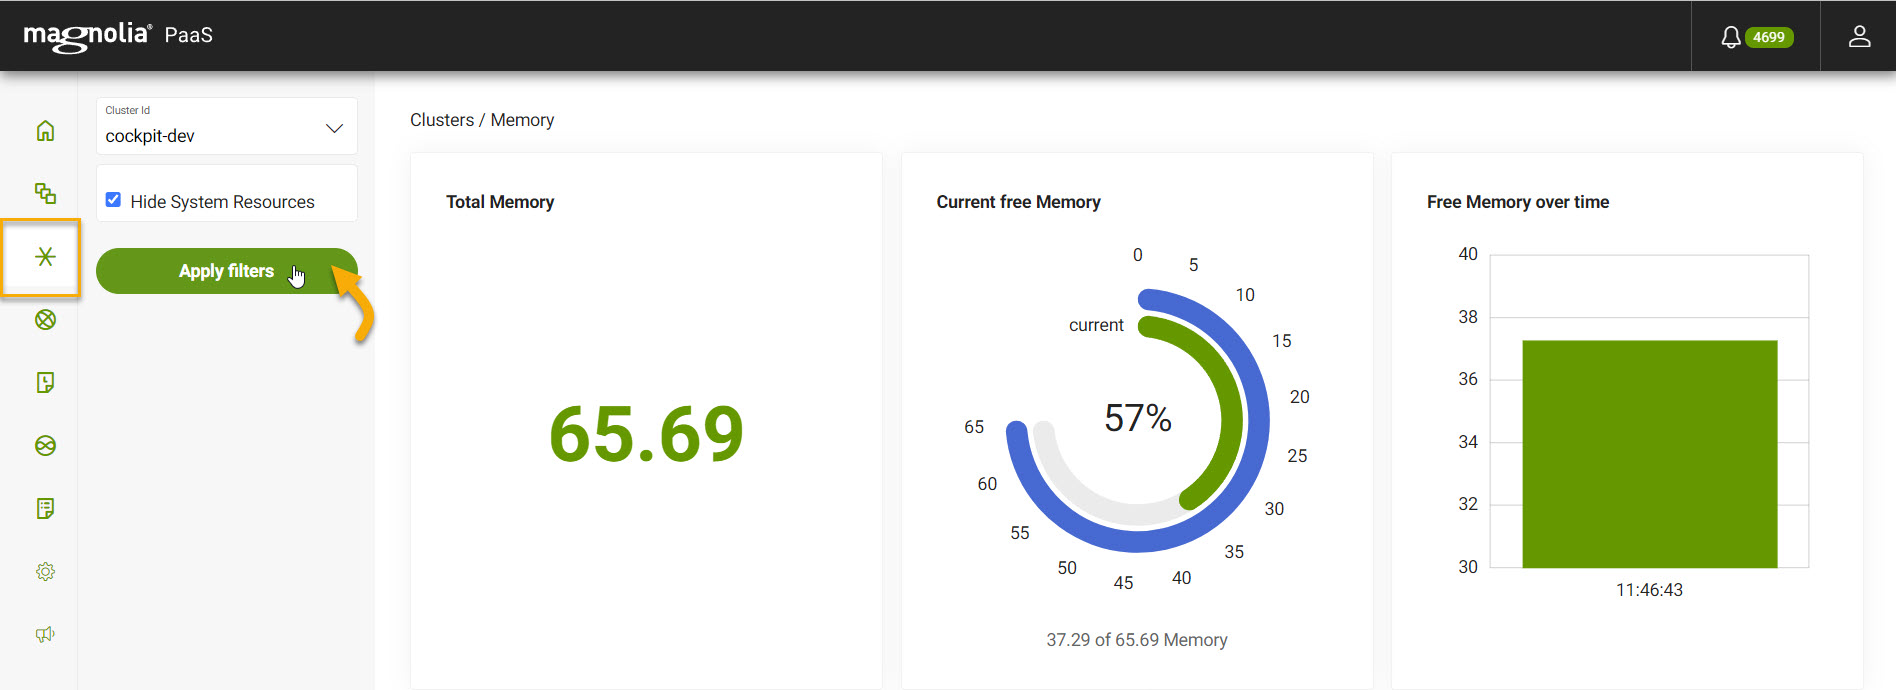
The Clusters Memory in the Cockpit displays information about memory for your Magnolia PaaS project.
View cluster Memory
-
Select the desired cluster from the dropdown menu entitled Cluster Id.
-
Optional If you want, click Show only Magnolia to only display the distribution used by Magnolia only.
-
Click Apply filters.
What info is displayed?The following information is displayed:
-
Total available Memory
-
Current Free Memory against the maximum available Memory
-
Free Memory over time
-
Total Memory reserved
-
Total Memory limit
-
Table breaking down Memory limits by node and type (app or database)
-
Storage
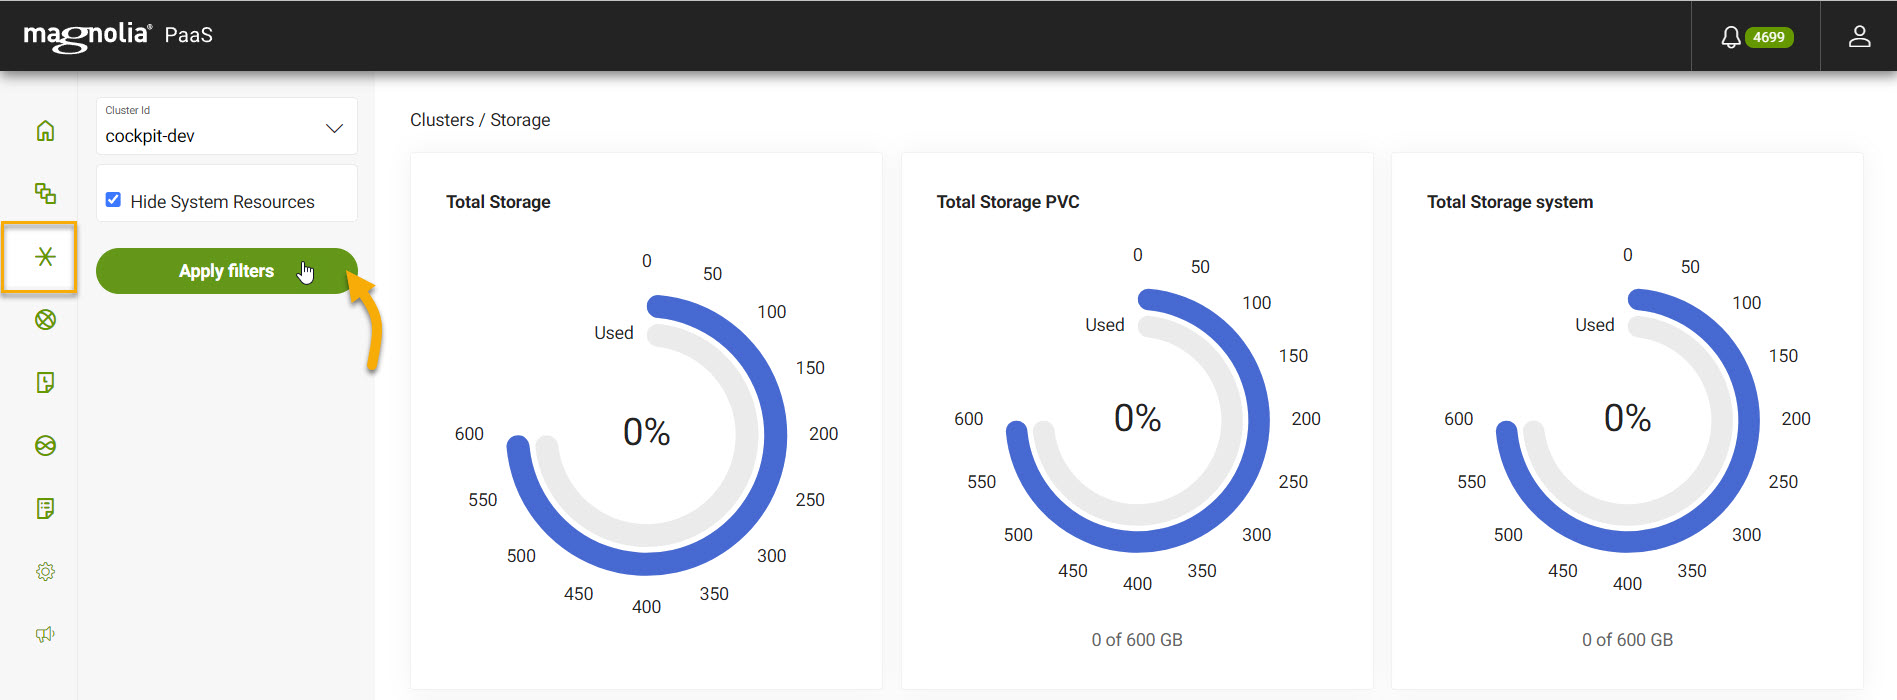
The Clusters Storage tab in the Cockpit displays information about Storage for your Magnolia PaaS project.
View cluster Storage
-
Select the desired cluster from the dropdown menu entitled Cluster Id.
-
Optional If you want, click Hide System Resources to only display the distribution used by Magnolia only.
-
Click Apply filters.
What info is displayed?The following information is displayed:
-
Total available Storage
-
Total Storage PVC
-
Total system Storage
-
Table breaking detailed storage information around state, access modes, volume modes, capacity, and age.
-