CDN statistics
You can view your CDN statistics for an active domain in a content delivery server.
| You must register a domain in the cockpit. If you haven’t done that, see Domains and Certificates. |
| The statistics sections remain empty until you enable a domain for the content delivery server. |
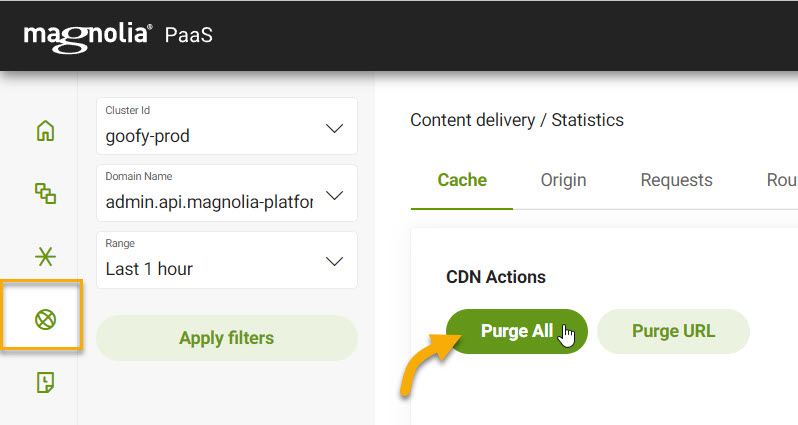
Purge All
To purge the entire cache from the content delivery server for the domains in the selector, click Purge All. Alternatively, you can purge by URL.
| For more, see Purging. |

| It does not currently purge your Magnolia instance’s cache. |
Purge URL
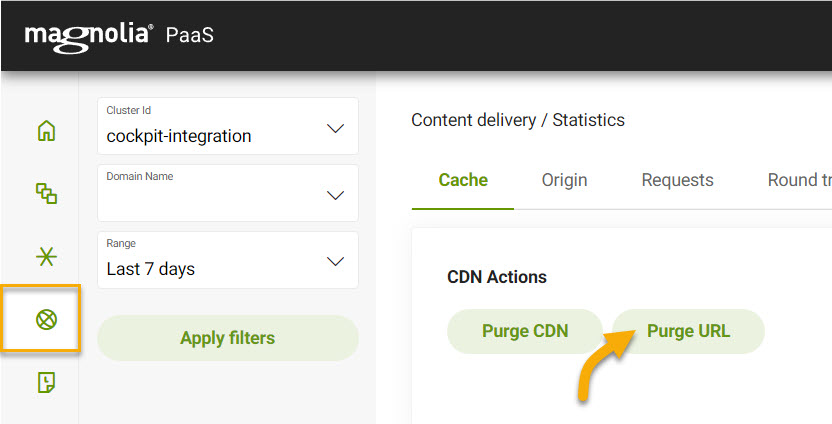
Instead of purging the entire cache, you may want to simply purge a single object from all cache servers. In this case, you will want to use the Purge URL option in the Cockpit.
-
Go to Content delivery > Statistics.
-
Under CDN Actions, click Purge URL.

-
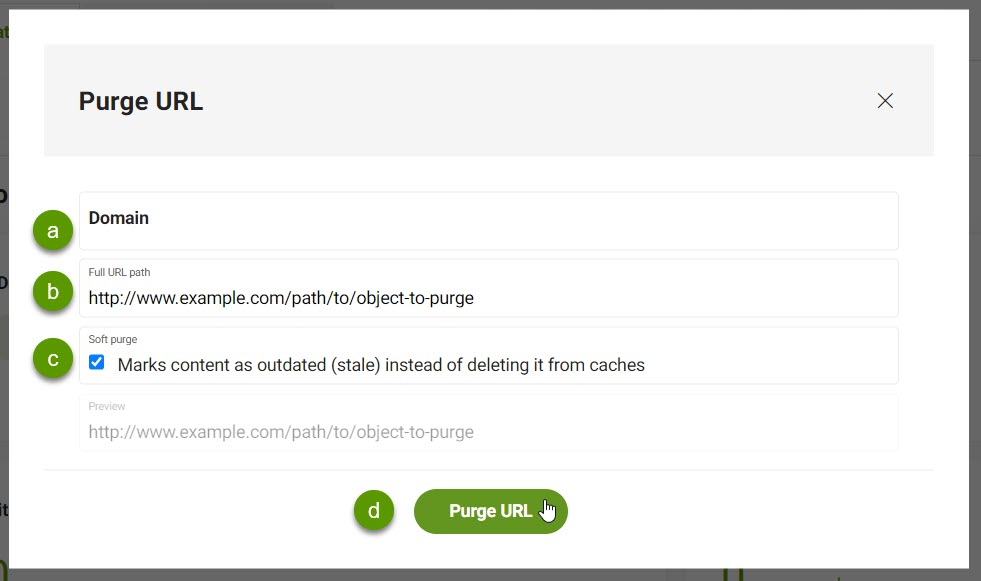
In the dialog:
-
Choose your desired Domain from the dropdown list.
-
Enter the Full URL path of the object that you want to purge.
-
Optionally select to perform a Soft purge.
If unselected, a hard purge is performed which immediately makes the object inaccessible. Soft purges mark the object as stale, but it is still accessible.
Stale objects can reduce backend loads by allowing for conditional revalidation and other performance-enhancing patterns. For more, see Fastly’s soft vs hard purge docs.
-
Click Purge URL.

-
View stats
-
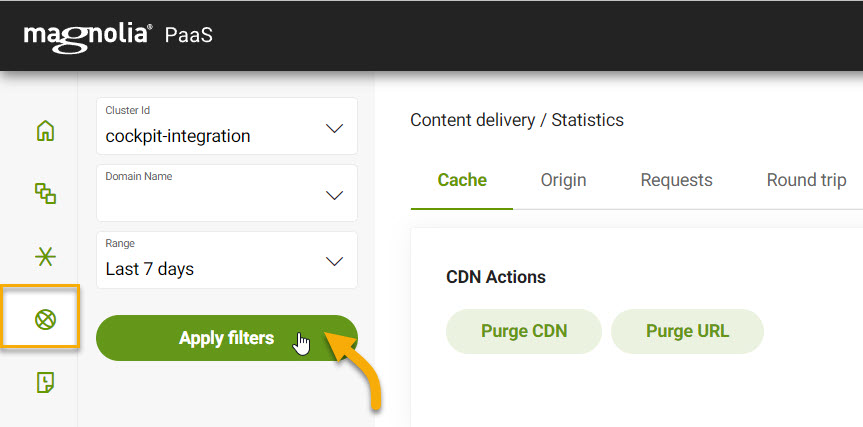
Go to Content delivery > Statistics.
-
Select the desired Cluster Id from the dropdown list.
-
Select the desired Domain from the dropdown list.
-
Select the Range for the statistics.
-
Click Apply filters.

Cache
| Statistic | Description | ||
|---|---|---|---|
|
Measurement (expressed as a percentage) of how many content requests the cache filled compared to how many requests it received. |
||
|
Hit ratio expressed over a timeline. |
||
|
The percentage of cacheable requests compared to all requests.
|
||
|
Cache statuses expressed as a percentage by category.
|
||
|
Cache coverage (as a percentage) expressed over a timeline. |
Origin
| Statistic | Description |
|---|---|
|
Displays (as a map) the requests per geographic zone. |
|
Displays the requests per geographic zone and host. |
Requests
| Statistic | Description |
|---|---|
|
Displays the number of total requests. |
|
Displays the number of total requests in the last 24 hours. |
|
Displays the number of total requests since the beginning of the current month. |
|
Displays a chart for the number of total requests per host as a percentage. |
|
Displays a graph for the request volumes coming in currently on a timeline. |
|
Displays a graph for the request volumes coming in currently on a timeline per host. |
|
Displays the rate of requests coming in on a timeline. This is requests per second. |
|
Displays the rate of requests coming in on a timeline per host. This is requests per second. |
Round trip
| Statistic | Description |
|---|---|
|
The average time it took to get a response after initiating network request. |
|
The average time it took to get a response after initiating network request for the last 24 hours. |
|
The average time it took to get a response after initiating network request since the beginning of the month. |
|
The average time it took to get a response after initiating network request on timeline. |
|
The average time it took to get a response after initiating network request on timeline per host. |
Duration
| Statistic | Description |
|---|---|
|
Graph showing how long requests are taking on a timeline. |
|
Graph showing how long requests are taking on a timeline, categorized by status. Statuses
|
|
Graph showing how long requests are taking on a timeline, categorized by host. |
Traffic
| Statistic | Description |
|---|---|
|
Shows the traffic volume in GB. |
|
Shows the traffic volume in GB over the last 24 hours. |
|
Shows the traffic volume in GB since the beginning of the month. |
|
Chart showing bytes transferred (in GB) over a timeline. |
|
Chart showing bytes transferred (in GB) over a timeline, categorized by host. |
HTTP statuses
| Statistic | Description |
|---|---|
|
Shows the total percentage of errors. |
|
Shows the total percentage of errors over the last 24 hours. |
|
Shows the total percentage of errors since the beginning of the month. |
|
Chart showing a breakdown of the HTTP statues returned, categorized by status, such as |
|
Timeline showing the number of INFO ( |
|
Chart showing HTTP redirects requests on a timeline, categorized by HTTP status code such as |
|
Chart showing HTTP error requests on a timeline, categorized by HTTP status code such as |