Environments
Your Magnolia PaaS Environments section contains critical information about your deployment’s health, response times, and overall usage. The environments you see in this section of the Cockpit are those configured in your .gitlab-ci.yml file.
You can:
-
View Statistics about your environments by release, component
-
Check in our your JCR content
-
Add Loggers
Statistics
The Statistics subsection reveals critical information about your Magnolia PaaS deployment and are broken down in individual tabs on the Cockpit.
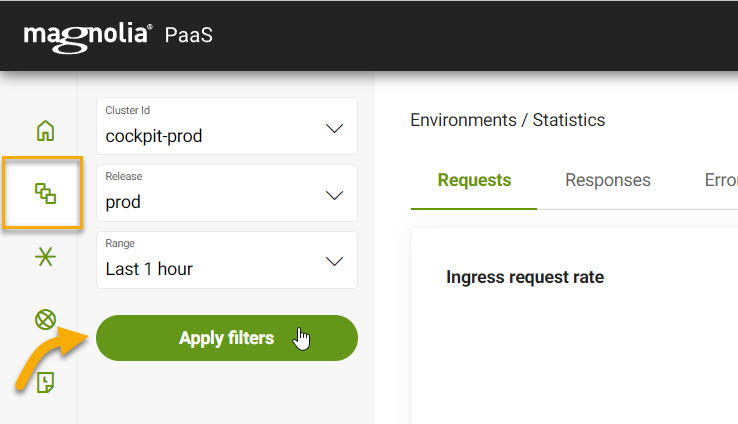
Select your Cluster Id, Release, and Range and apply the filters to display environment statistics.
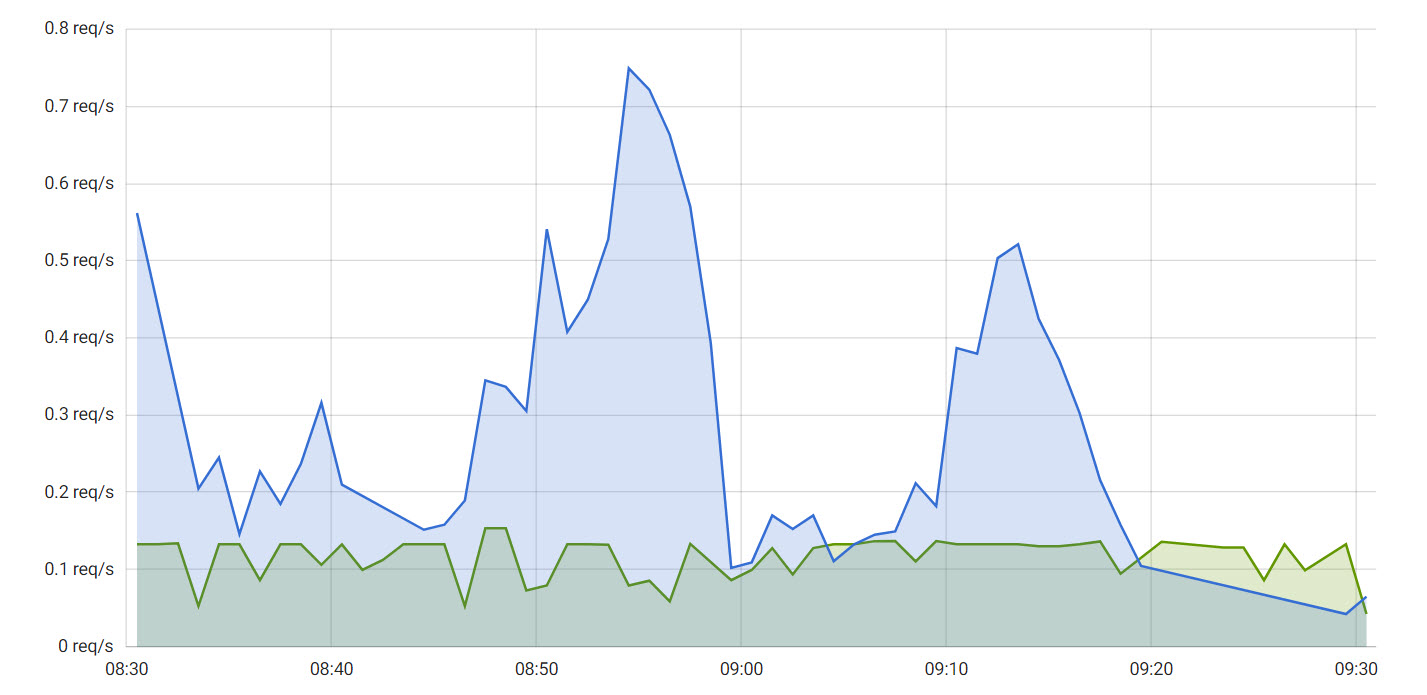
Requests
The Requests tab displays the following information:
The number of HTTP requests per second and per service at the ingress level.
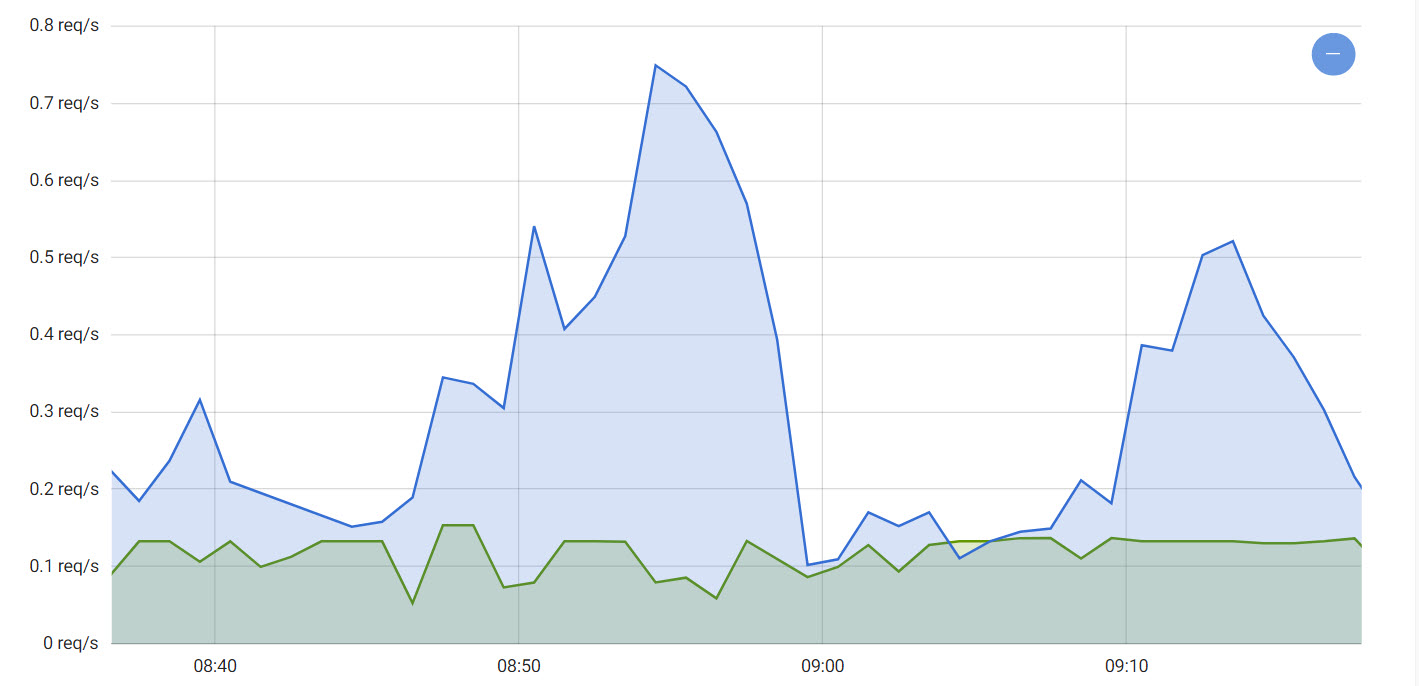
The number of HTTP requests per second and per service at the Magnolia level.
Responses
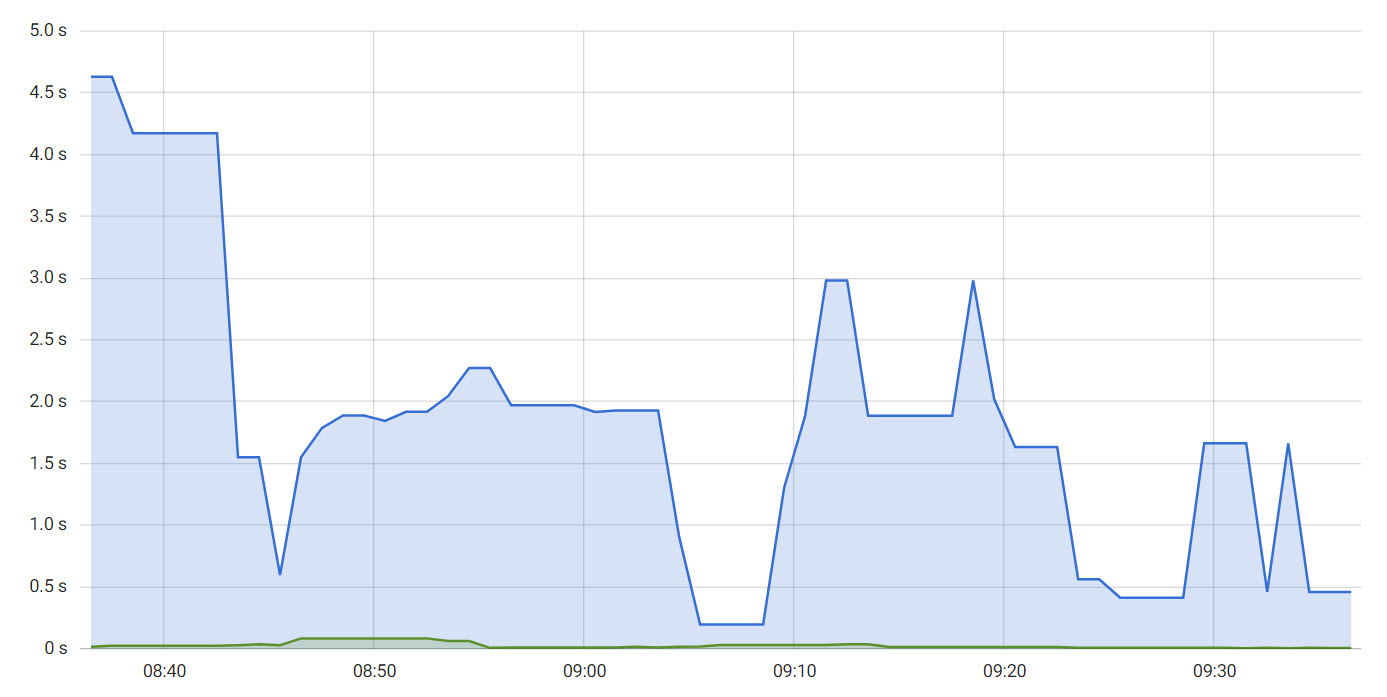
The Responses tab displays the following information:
The average HTTP response time per service at the ingress level.
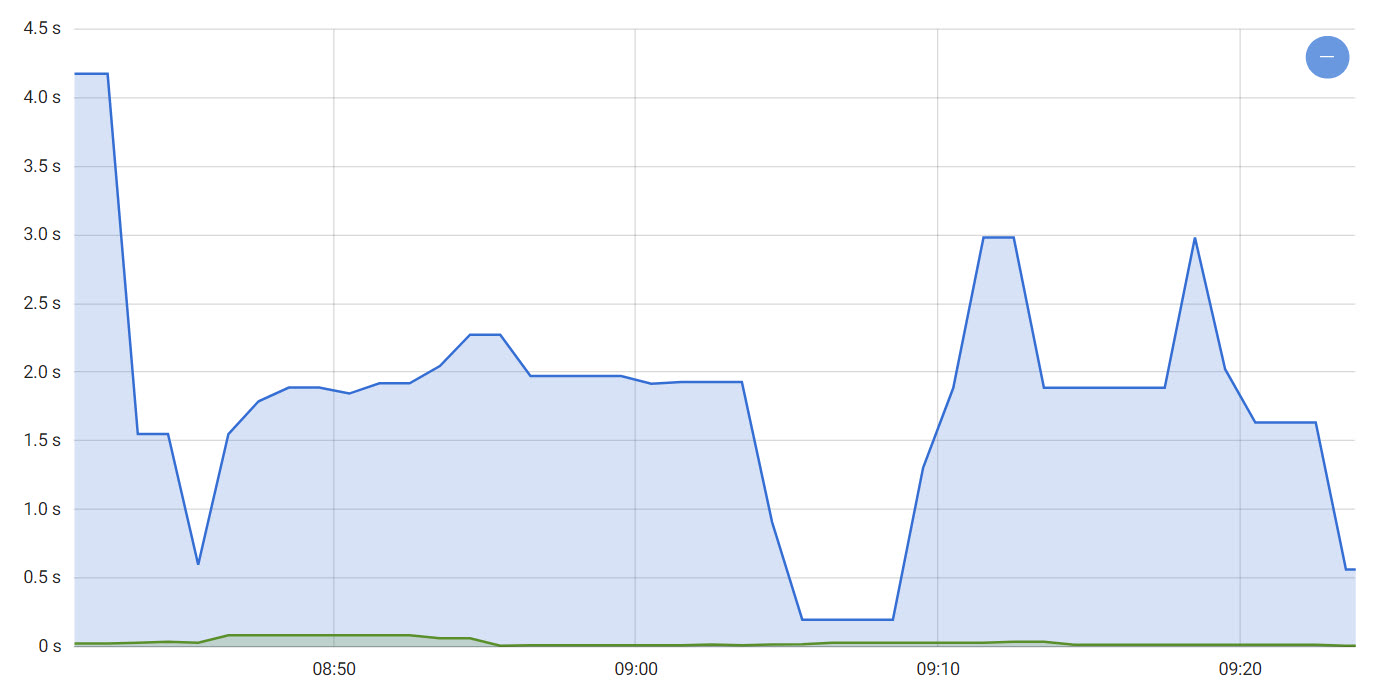
The average HTTP response time per service at the Magnolia level.
Memory
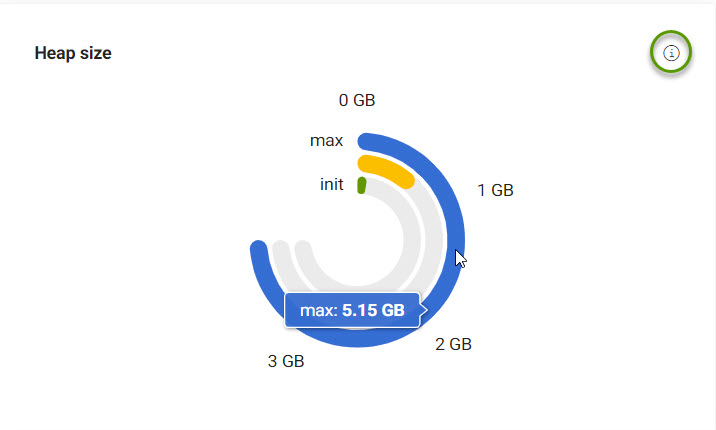
The Memory tab displays the following information:
The starting size, maximum size, and current size in bytes of the Magnolia instance.
| Hover over an item to see more details. |
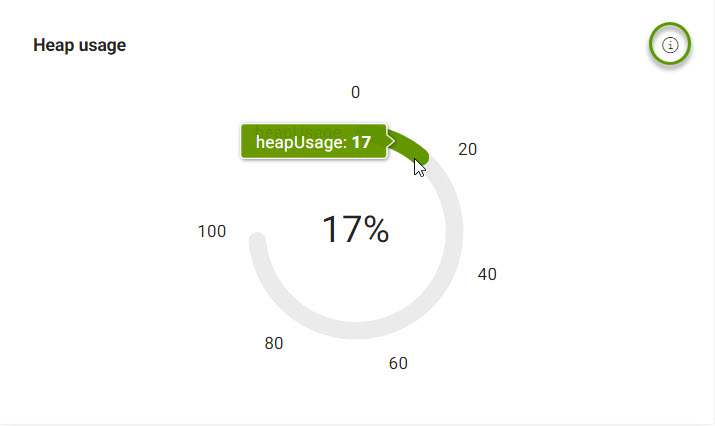
The percentage of JVM currently used by the Magnolia instance.
| Hover over an item to see more details. |
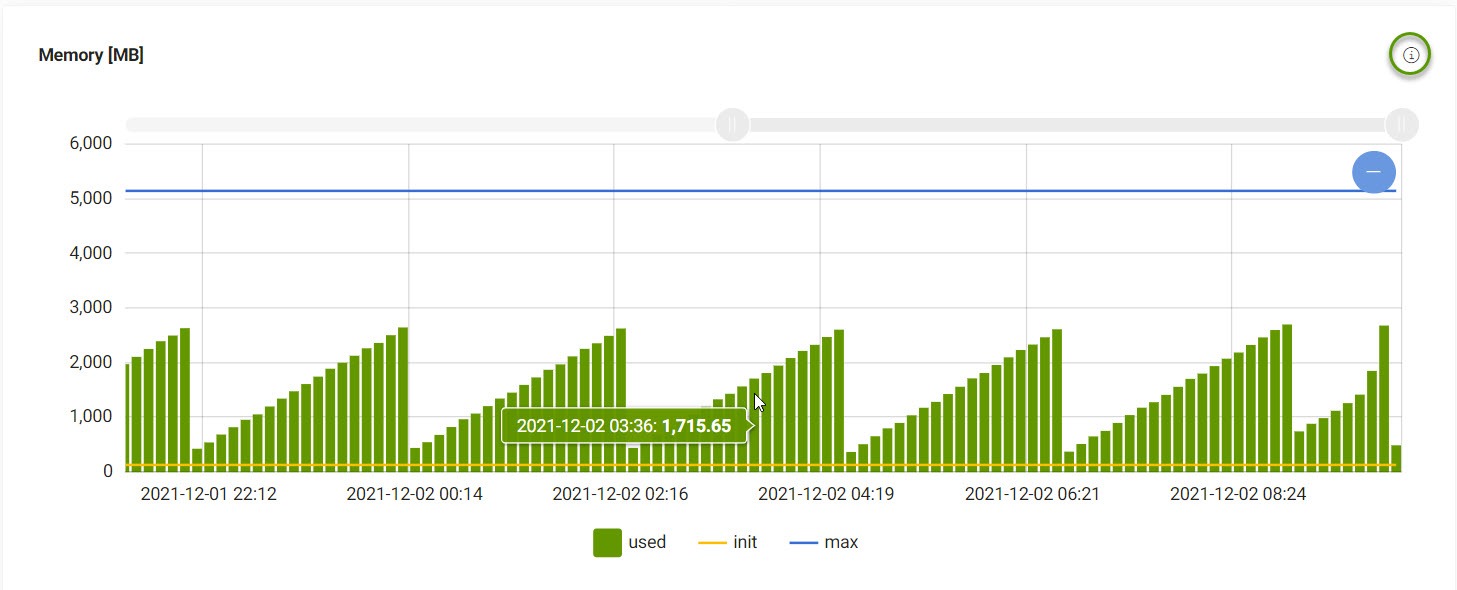
The starting size, maximum size, and current size in bytes for the Magnolia instance over time. The starting and maximum sizes are set at startup and will not change unless Magnolia is restarted.
| Move the slider to your desired date range. |
| Hover over an item to see more details. |
CPU
The CPU tab displays CPU Usage:
The CPU usage over time per pod including backend, frontend, and databases.
Storage
The Storage tab displays Storage Usage:
The Storage usage over time per pod including backend, frontend, and databases.
Cache
The Cache tab displays the following information:
The date and time when the Magnolia default page cache was last flushed.
The date and time reflect your current time zone.
Hits on the Magnolia default page cache by request category.
|
images in Magnolia DAM |
|
fonts in Magnolia DAM |
|
videos in Magnolia DAM |
|
audio clips in Magnolia DAM) |
|
other digital content in Magnolia DAM |
|
image resources |
|
Javascript resources |
|
CSS resources |
|
other resources |
|
processed images |
|
processed videos |
|
other processed content |
|
Magnolia backend requests |
|
Magnolia REST endpoint requests |
|
Magnolia monitoring metrics |
|
requests to Magnolia starting with ":" |
|
all other requests |
JCR content
The Environments subsection displays information related to JCR content for your Magnolia PaaS project. From here, you can see metrics on the size of frontend environments within JCR workspaces as well as query or count node types on a workspace.
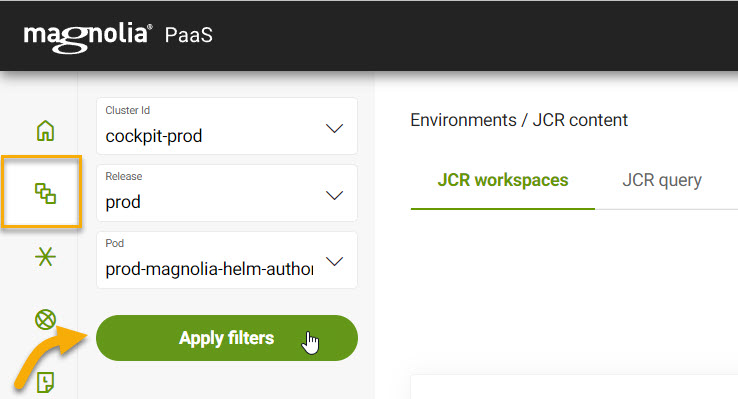
In this section, you need to select your desired Cluster ID, Release, and Pod as the metrics and results are related to the choices there.
JCR workspaces
In this JCR workspaces tab, you can see the number of nodes from the nt:base type per JCR workspace.
The table displays the name of the workspace and the size of the associated frontend environment.
JCR query
In the JCR query tab, you can see the most common node types in the applicable workspace including those shown below. You can also use the Query generator to count or query a certain node type per selected workspace.
-
mgnl:base(website workspace) -
mgnl:area(website workspace) -
mgnl:component(website workspace) -
mgnl:asset(dam workspace)
Query generator
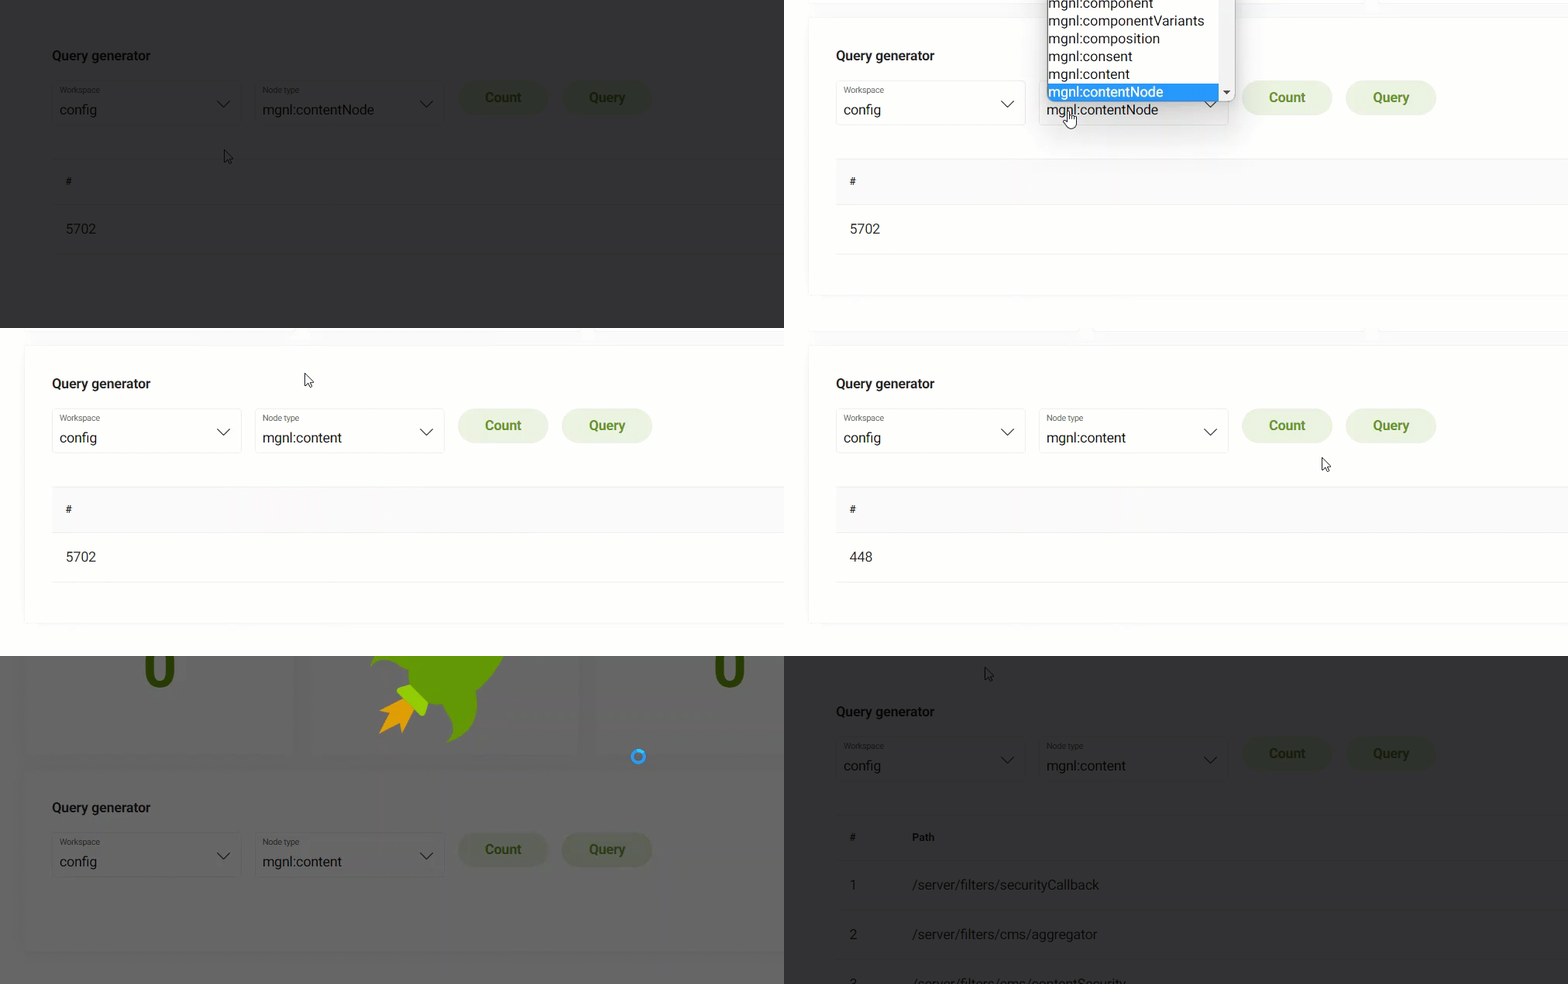
To use the JCR Query generator:
-
Go to Environments > JCR content > JCR query (tab).
-
Scroll to the Query generator.
-
Select a Workspace.
-
Select a Node type.
-
Select Count or Query.
Count counts the number of node types per workspace.
Query queries the node types in a workspace to show you the paths.
-
Persistence database
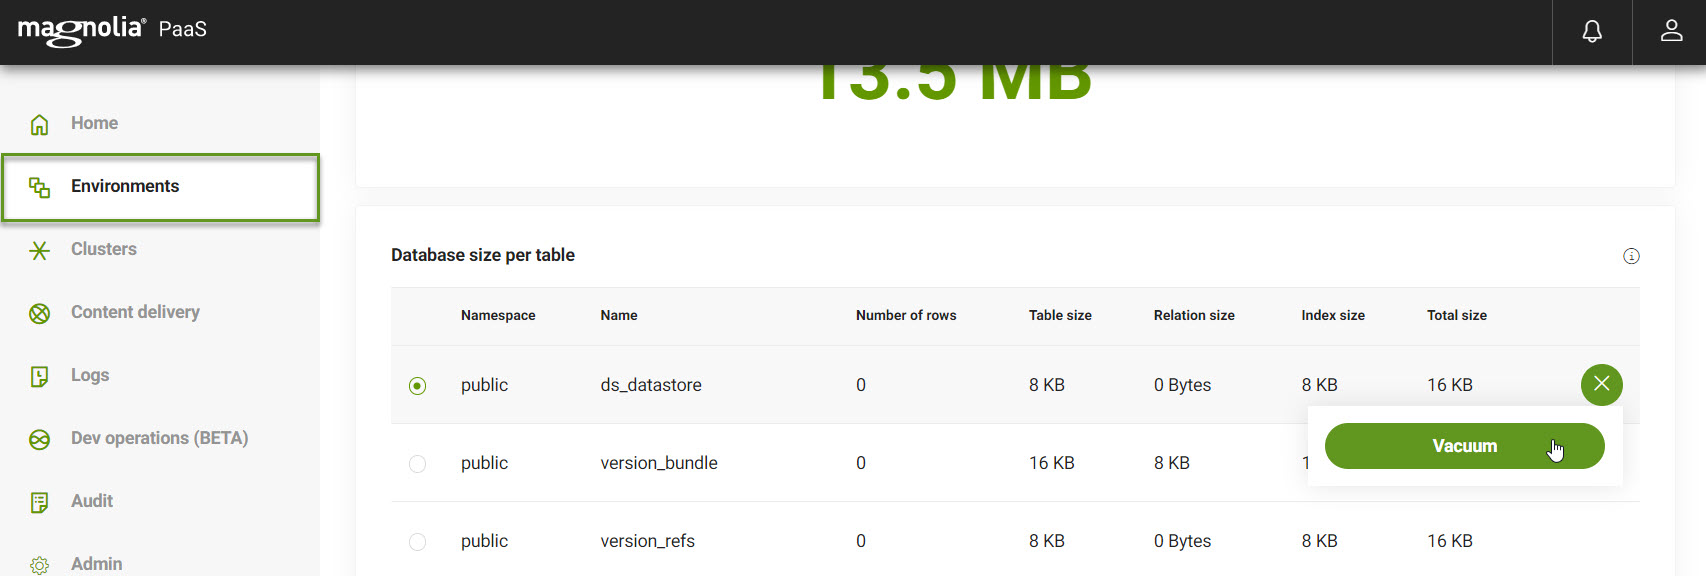
The Persistence database gives you an area to quickly see the size of the database. This is displayed under Database size at the top of the page. You can also see the size per table which is shown in the table on the tab.
Here, you can see:
-
The namespace
-
The database name.
-
The number of rows in the database.
-
The size of the database.
-
The relation size.
-
The index size.
-
The total size of the database.
Vacuum database
If you want to vacuum your database and keep things running a little tighter, you can do that by simply clicking the accordion symbol to the right of your chosen database and clicking the Vacuum button. You’ll be prompted to be sure that’s what you want to do before officially hoovering up that unwanted space.
For more on the VACUUM command, see here.
|
Publications
The Publications tab under Environments lets you view publishing operations from the Cockpit. Publishing operations consist of publishing content from Author to Public.
View Publications
-
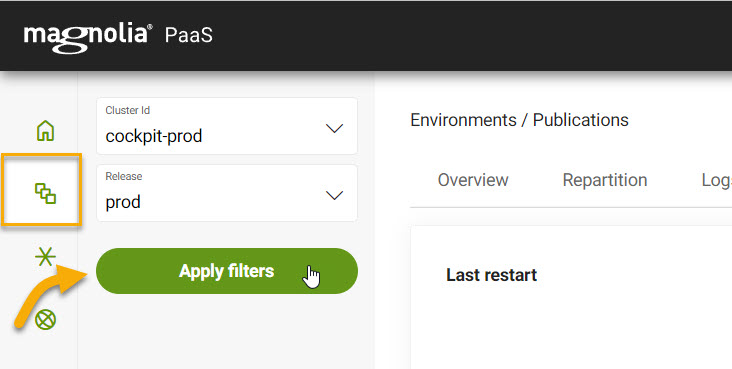
From your Cockpit, go to Environments > Publications (tab).
-
Choose your desired Cluster ID and Release from the dropdown menus.
-
Choose your desired actions from the available tabs.
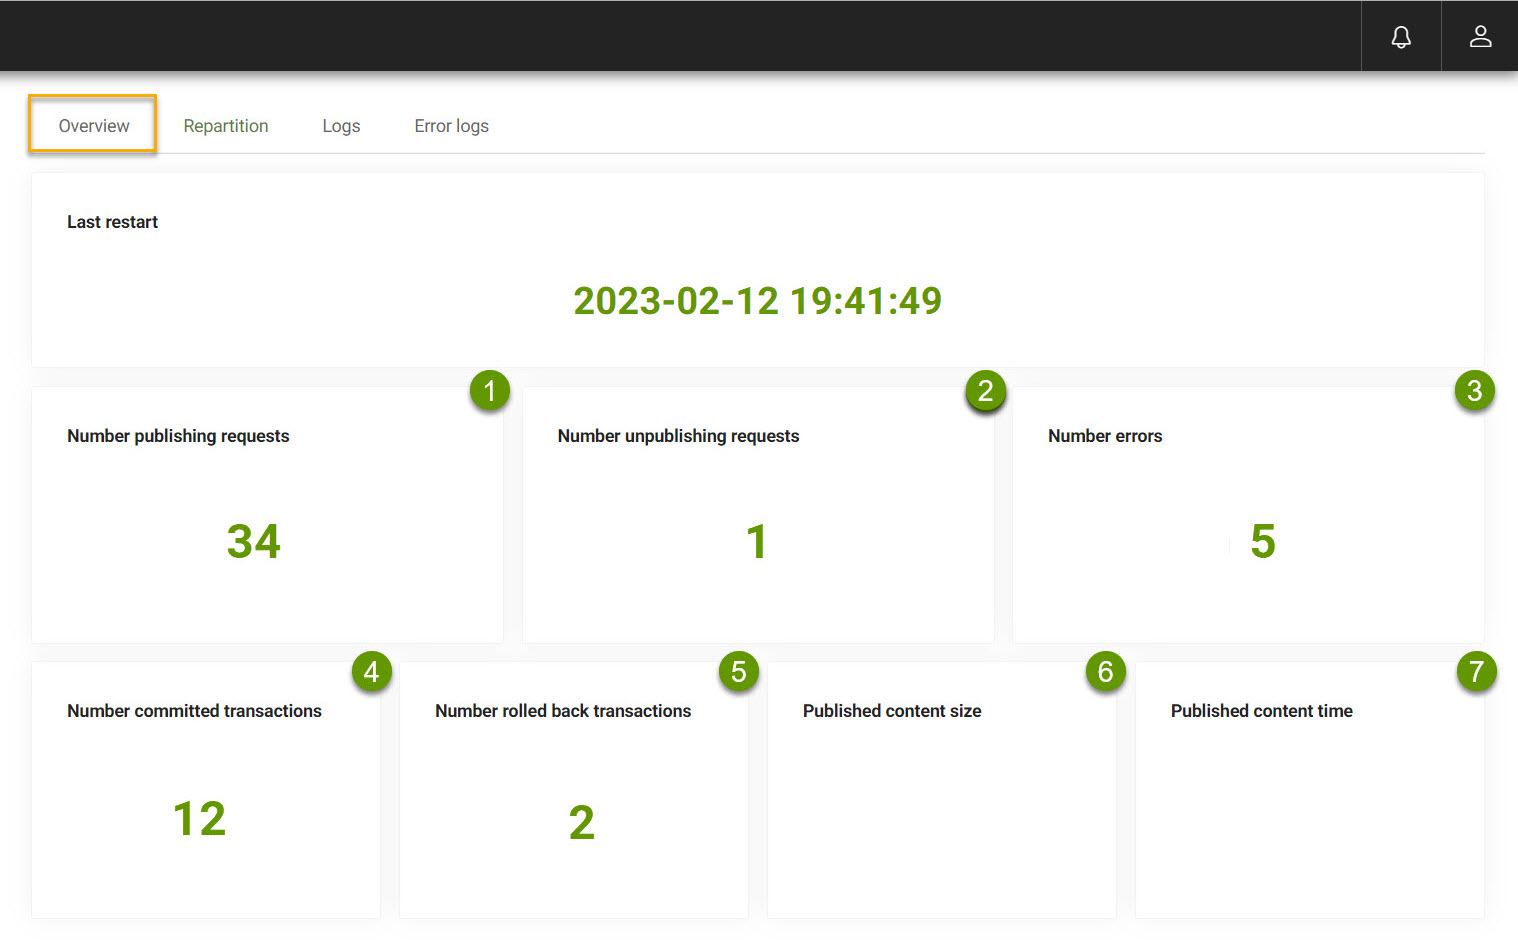
View the publication operations in this tab.
-
publishing requestswhen content is published from Author to Public. -
unpublishing requestswhen content is unpublished. -
errorswhen a publishing error occurs. -
committed transactionswhen content is commited. -
rolled back transactionswhen content is rolled back from Public back to Author. -
published content sizeshows in bytes the total value for publish content -
published content timeshows in milliseconds how much time it took to publish content
View Repartition requests per workspace and subscriber in this tab.
View all Log entries in this tab.
View all Error Log entries in this tab.
-
Loggers
The Loggers tab under Environments lets you add Loggers from the Cockpit as opposed to doing it in AdminCentral within Magnolia itself.
| For more on Loggers in Magnolia, see Log Tools app. |
Manage Loggers
You can add, adjust levels, and delete Loggers from the Cockpit.
-
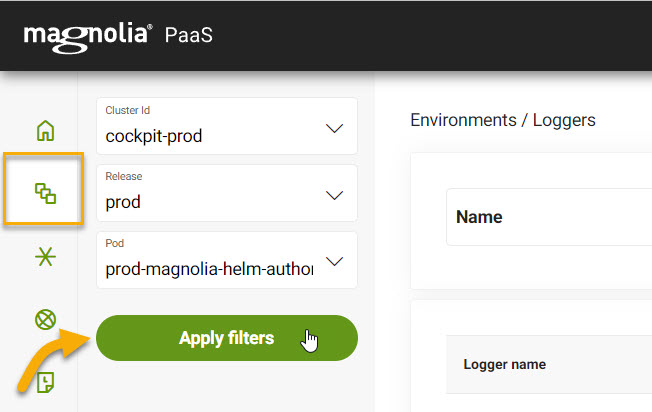
First, in your Cockpit go to Environments > Loggers.
-
Select your Cluster Id, Release, and Pod to display your Loggers.
-
Now, you can add, adjust, or delete Loggers.
At the top of the page:
-
Enter a Name and Level for your Logger.
-
Click Add.

-
Scroll to your desired Logger.
-
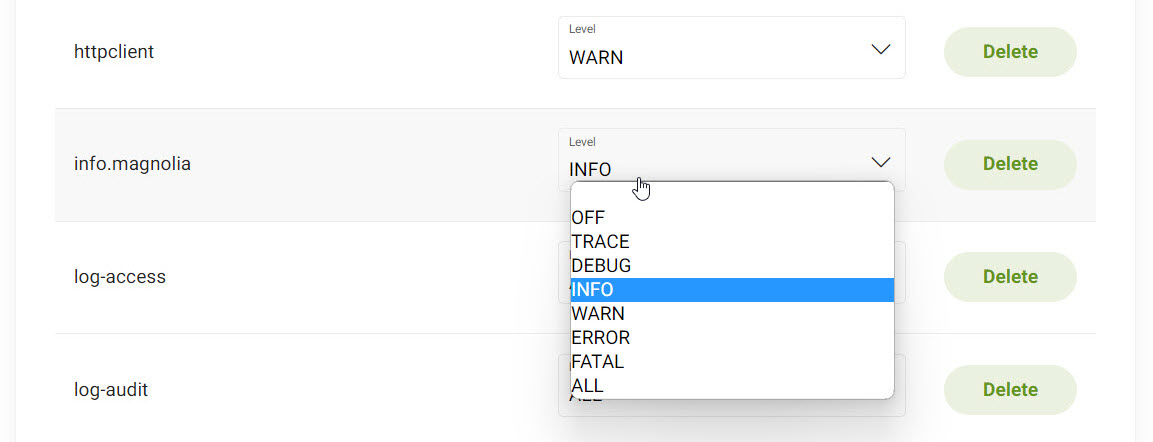
In the Level dropdown menu, select your desired log level[1].
-
Scroll to your desired Logger.
-
Click Delete.

-
Manage your environments
Manage your environments via the Cockpit by going to Environments and selecting Manage. You can manage both your integration and production (prod) environments here. Within the environment, you are able to manage your Magnolia PaaS backend and frontend separately.
| The examples and descriptions below apply to both backend and frontend environments as well as both author/public instances. |
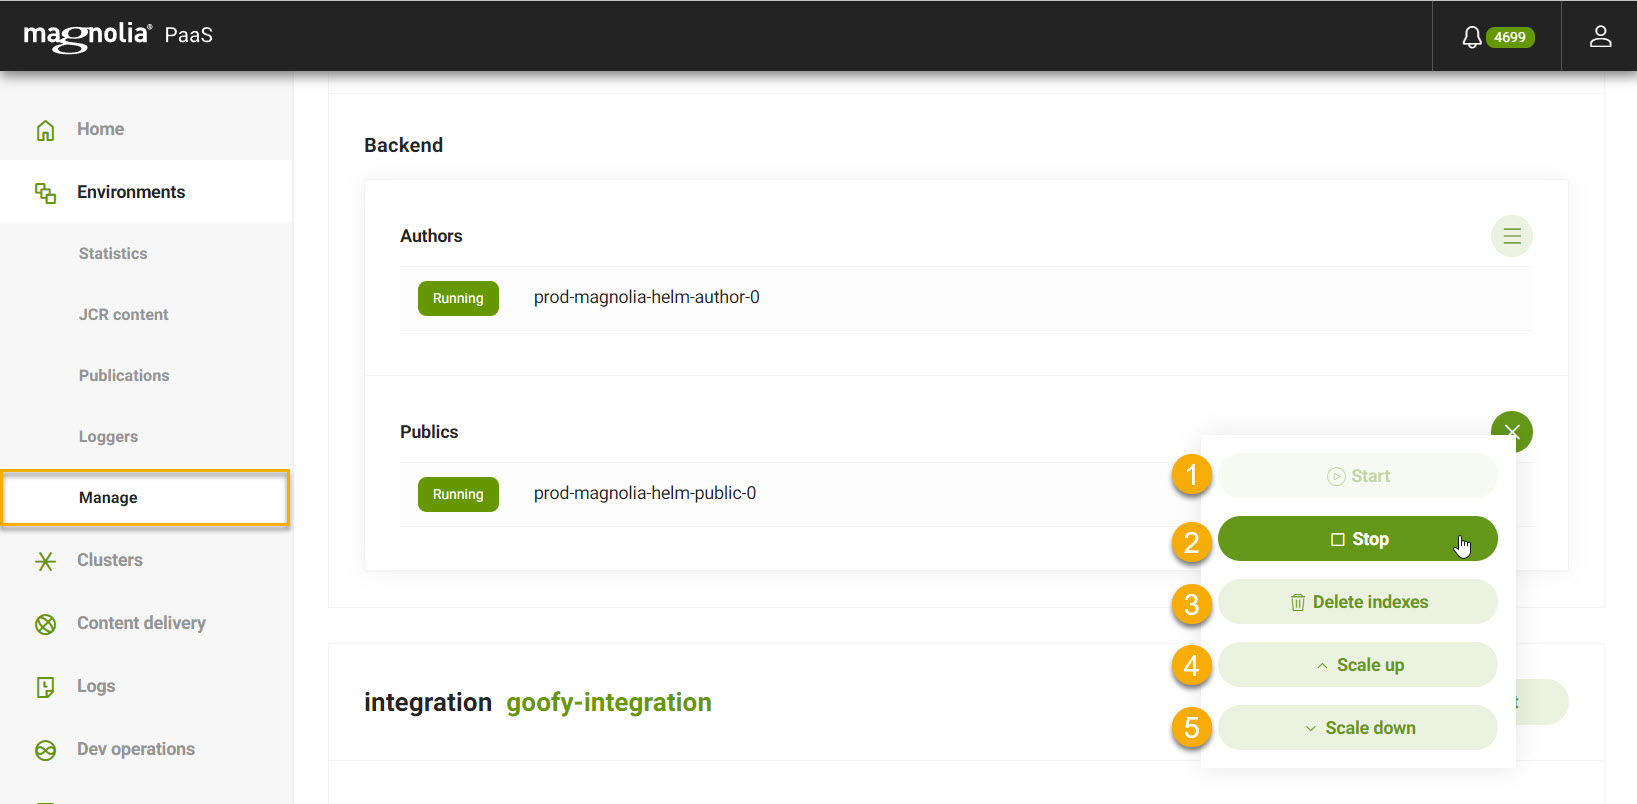
| No | Item | Description | ||
|---|---|---|---|---|
|
Start |
Start your environment. |
||
|
Stop |
Destroys all instances down to |
||
|
Delete indexes |
Delete the environment’s indexes. See Delete an index for instructions.
|
||
|
Scale up |
Adds a public instance.
|
||
|
Scale down |
Destroys a single public instance.
|
Delete an environment
You can delete an environment directly from the Cockpit.
| This action permanently deletes the selected environment and cannot be undone. |
Reset the superuser password
In case you get stuck, locked out of the Authoring environment, or simply need to reset the superuser password for your author environment(s), you can do that directly via the Cockpit. Once you reset the superuser password on the author environment, you can publish the new password to the public environment.
| You must have administrator privileges to perform this action. |
Instructions
-
Go to Environments > Manage.
-
Scroll to the environment where you want to reset the password.
-
On the Authors instance, click the ellipsis to the right.
-
Choose Reset superuser password. A dialog will pop up
-
Enter the new password under Create new superuser password.
-
Confirm the new password under Confirm new superuser password.
-
Click Reset superuser pass. to officially reset the password.
-
Delete an index
You may want to completely delete the index for an environment. This can be done directly through the Cockpit.
After deleting an index, the system restarts and rebuilds them based on the data found in the persistence database.
Downtime varies depending on the amount of data associated with an index. This duration ranges from seconds to hours depending. To help reduce this downtime, we use the rollingUpdate approach.
To delete the index folders:
-
Go to Environments > Manage.
-
Click Delete indexes for the desired environment.
ALL; TRACE; DEBUG; INFO; WARN; ERROR; FATAL; OFF.
