Rendering probes
The rendering probes monitor the time taken to render pages, area and components by the rendering engine. Unlike most other probes, the rendering probes must be configured in the rendering engine, not the Instrumentation module.
The rendering probes can capture the following:
-
what is being rendered (a page, area or component)
-
the template being rendered
-
the path being rendered
These are included as labels to a measurement. You can use the labels in queries to narrow down the results returned.
| The rendering probes are implemented as rendering engine listeners (info.magnolia.rendering.listeners.AbstractRenderingListener) and are called as the rendering engine is executed. |
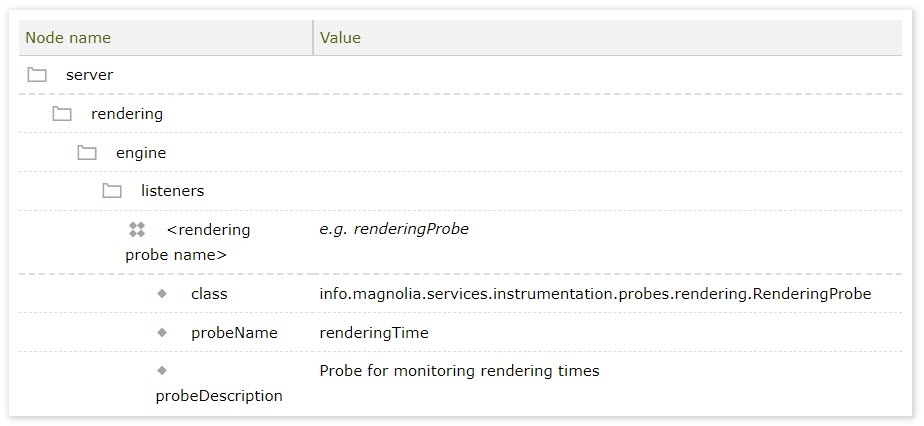
RenderingProbe
The RenderingProbe the time it takes to render pages, area and components.
Configuration properties
| Property | Description | Required | ||
|---|---|---|---|---|
|
Should be |
|||
|
The name of the rendering listener.
|
|||
|
Enable or disable the collection of rendering metrics for this probe. Default = |
|||
|
The metric name. |
|||
|
A description of the metric. |
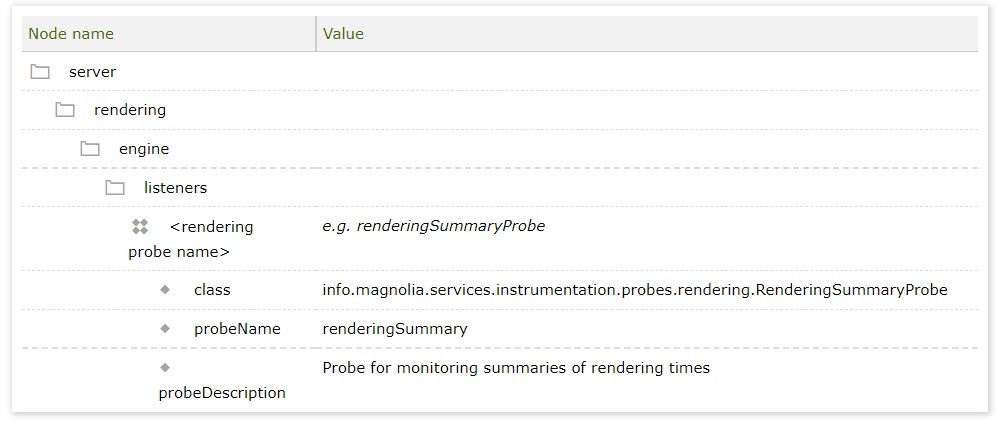
RenderingSummaryProbe
The RenderingSummaryProbe keeps a running total of the time it takes to render pages, area and components.
RenderingSummaryProbe uses the Prometheus Summary (io.prometheus.client.Summary) collector. RenderingSummaryProbe is easier to work when creating histogram or heat maps of rendering time distributions.
Configuration properties
| Property | Description | Required | ||
|---|---|---|---|---|
|
Should be |
|||
|
The name of the rendering listener.
|
|||
|
Enable or disable the collection of rendering metrics for this probe. Default = |
|||
|
The metric name. |
|||
|
A description of the metric. |
RenderingSummaryProbe
Unlike other probes that report their measurements to Prometheus, the RenderingLogger probe will report rendering times to a logging destination.
RenderingLogger simply logs each rendering time along with the target, path and template to a log.
RenderingLogger can be configured to output a log in a convenient, easy to import CSV (comma separated values) text format, that can be imported for further analysis. By default, the log message created by RenderingLogger will be:
{0},{1},{2},{3},{4}where the placeholders above are:
-
0= the rendering target, either page, area, component or unknown -
1= the path -
2= the template -
3= the rendering time in milliseconds
RenderingLogger, because it can produce a very large number of logging messages, may not be suitable for use with Magnolia instances rendering lots of items since it may reduce Magnolia performance.
|
We recommend RenderingLogger and its logging configuration to set up as follows:
|
Configuration properties
| Property | Description | Required | ||
|---|---|---|---|---|
|
Should be |
|||
|
The name of the rendering engine listener.
|
|||
|
The logger name. Default
|
|||
|
An output format suitable for use with java.text.Message (see java.text.MessageFormat). The valid placeholders are:
Default
|
Log4j
Here’s a simple log4j appender to capture the logging output from RenderingLogger to a log file name monitor-rendering.log, limited to 10 megabytes and 5 backups:
<appender name="monitor-rendering" class="org.apache.log4j.RollingFileAppender">
  <param name="File" value="logs/monitor-rendering.log" />
  <param name="MaxFileSize" value="10MB" />
  <param name="MaxBackupIndex" value="5" />
  <param name="Append" value="true" />
  <layout class="org.apache.log4j.PatternLayout">
    <param name="ConversionPattern" value="%d{dd.MM.yyyy HH:mm:ss},%m%n" />
  </layout>
</appender>
And here’s a log4j category to generate the logging messages:
<category name="info.magnolia.services.instrumentation.probes.rendering.RenderingLogger">
  <priority value="DEBUG"/>
  <appender-ref ref="monitor-rendering"/>
</category>| No metrics or labels are provided; cache activity is logged rather than collected by Prometheus. |

